Filter
None
Sort
Last updated
Listed in:
Topics
Plot Examples | Observable | Observable
Plot Examples | Observable | Observable
Plot Examples
Public
Find inspiration and techniques to create beautiful and appropriate charts with Observable Plot. This collection highlights best practices and real use cases.
Filter
None
Sort
Published
995
6
959
Follow
Bubble Matrix
Public
Fil
Apr 4, 2022
17
Bump chart
Public
Fil
Jan 31, 2024
46
Ireland’s top trade partners
Public
Fil
Apr 4, 2022
16
COVID-19 Netherlands Reproduction Number Tutorial
Public
Martien van Steenbergen
Feb 1, 2022
3
9
Bertin’s hotel
Public
Fil
Apr 4, 2022
30
Database Outage Plot
Public
Fil
Apr 4, 2022
7
Log-scale histogram
Public
Fil
Apr 4, 2022
7
Renko Chart
Public
Fil
Apr 4, 2022
14
Phone bar plots
Public
Fil
Jun 1, 2021
2
Plot Hyperboloid
Public
Fil
Jun 4, 2021
17
Raincloud Plots with Observable Plot
Public
Torsten Sprenger
Feb 11, 2023
66
Plot stargazer history
Public
Fil
Jul 5, 2025
9
2
Horizon graph & Barcode with Plot
Public
Irene de la Torre
Jun 16, 2021
3
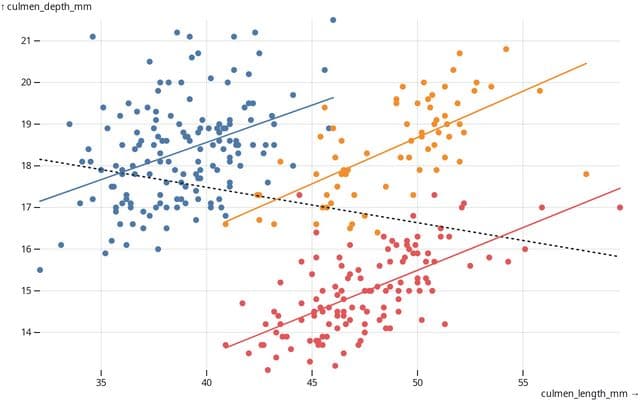
Plot: regression
Fork
Public
Fil
Nov 19, 2022
44
9
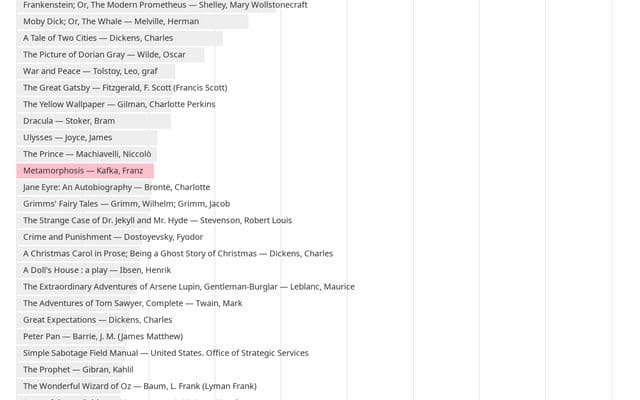
Happy anniversary, Project Gutenberg!
Public
Fil
Jan 26, 2023
16
3
Skies Plot
Public
Fil
Jul 13, 2022
16
ROC curve
Fork
Public
Fil
Apr 4, 2022
15
ELD Viewer
Public
Fil
Apr 3, 2022
11
Temporal Aliasing
Public
Yuri Vishnevsky
Jul 26, 2021
25
Plot for mathematicians
Public
Mark McClure
Jun 24
63
6
Plot Isotype dot plot
Fork
Public
John Alexis Guerra Gómez
Aug 14, 2021
12
2
Matrix diagram
Public
Fil
Apr 4, 2022
13
K-means binning
Public
Fil
Apr 4, 2022
38
1
Plot Mountain Sunset
Fork
Public
Zan
Sep 9, 2021
6
Spine charts
Public
rcatlord
Sep 22, 2021
7
Greenhouse gas emission projections
Public
rcatlord
Sep 15, 2021
12
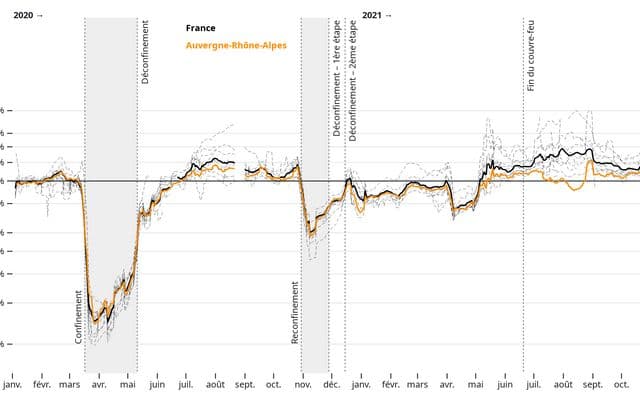
Road traffic under COVID restrictions (France)
Public
Fil
Oct 27, 2021
43
Plot: Bullet graph
Public
Fil
May 9, 2023
16
4
Bullet graph II
Fork
Public
Fil
Oct 12, 2021
11
Cyclical time scale
Public
Fil
Aug 16, 2024
16
1
Cyclical time scale, v2
Public
Fil
Apr 4, 2022
8
Upset Plots with Observable Plot
Public
Torsten Sprenger
Feb 10, 2023
78
Exploring CIELChab
Fork
Public
Visnu Pitiyanuvath
Dec 3, 2021
5
Nature variant waves graphic
Public
Chris Ryan
Feb 25, 2022
1
When Presidents Fade Away
Public
Robert Lesser
Mar 1, 2022
19
The Coronavirus landscape
Public
Benjamin Schmidt
May 10, 2022
7
7
Our World In Data charts visualisation
Fork
Public
Daniel Bachler
Apr 4, 2022
2
The normal model
Public
Mark McClure
Sep 6, 2023
6
Visualizing The New York Times’s Mini Crossword
Fork
Public
Toph Tucker
Feb 20, 2024
36
9
Plot of plots
Public
Fil
Sep 15, 2023
34
6