Sandraviz
Data Visualisation/UI Engineer
I'm building interactive, data-driven interfaces that help people explore, understand, and communicate complex information.
Public collections
Showing all 11 collections

Based on my own experience I know how big is the gab between learning simple d3.js examples and the actual fancy stuff you see around the web. In this 30 days course I provide you with a setup for creating your own first impressive web-based dataviz

A collection of notebooks about ethical challenges in the space of AI.

D3.js data visualisation portfolio

Arquero is a JavaScript library for query processing and transformation of array-backed data tables. Following the relational algebra and inspired by the design of dplyr, Arquero provides a fluent API for manipulating column-oriented data frames.
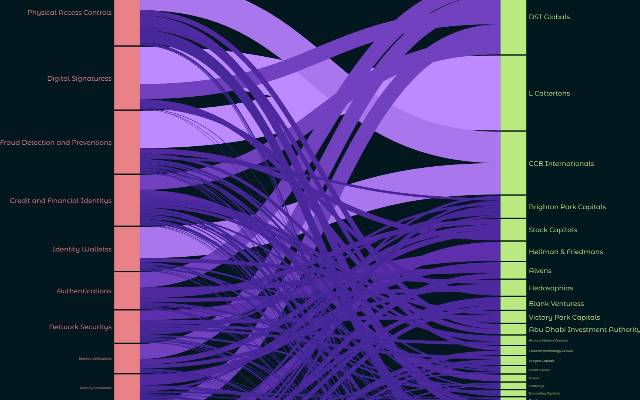
Design a Dashboard for Investors and Investments
You aim to conceptualize and design a dashboard that displays key information about investors and their investments.
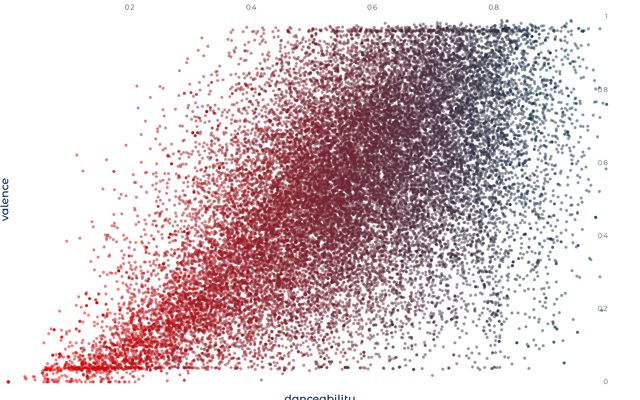
From static to dynamic scatter plot using Spotify data.

EDA and storyline draft about global inequality.

EDA and interactive and animated d3.js visualisation about disasters in the US, which created a damage worth one billion minimum in the years since 1980 until today.

O coleção de notebook usado no curso de Especialização em Análise de Dados e Visualização da Informação de universidade NOVA em Lisboa/Portugal.

Observable Plot is a free, open-source, JavaScript library for visualizing tabular data, focused on accelerating exploratory data analysis written on top of d3.js.
