Notebooks
Resources
Pricing
Sign in
Get started
categori.se
/
...
Public
charts and plots
Showing all
13
listings
Hexgrid Geo Plot
categori.se
Apr 27, 2023
•
4
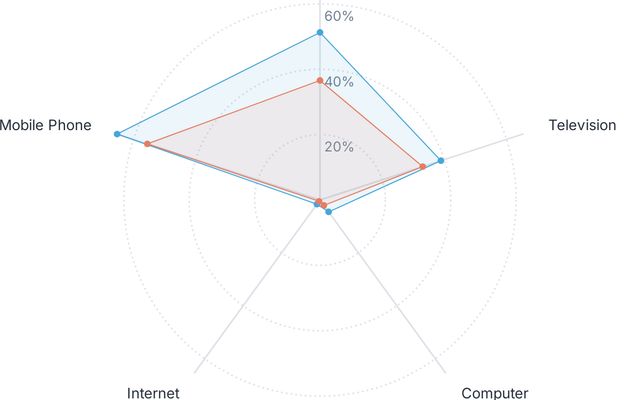
Radar Chart
categori.se
Apr 26, 2023
•
1
Area Chart
categori.se
Apr 25, 2023
Bubble Map
categori.se
Feb 4, 2023
•
8
27
Nepal Grid Map
categori.se
Apr 25, 2023
•
1
Hexgrid Geo Plot
categori.se
Apr 25, 2023
•
3
Treemap
categori.se
Apr 25, 2023
•
3
Slope Chart
categori.se
Apr 25, 2023
•
1
Bar Chart
categori.se
Apr 25, 2023
•
1
Line Chart
categori.se
Apr 25, 2023
•
3
Access to Household Facilities, Nepal, 2011
categori.se
Apr 25, 2023
•
3
Population Pyramid Plot
categori.se
Apr 25, 2023
•
8
Isotype Unit Chart
categori.se
Apr 25, 2023
•
8