Notebooks
Resources
Pricing
Sign in
Get started
Diénert Vieira
/
...
Public
Visualização de Dados
Introdução a D3 e Plotly
Showing all
9
listings
1.
Introdução a CSS, SVG e D3
Diénert Vieira
Nov 20, 2020
2.
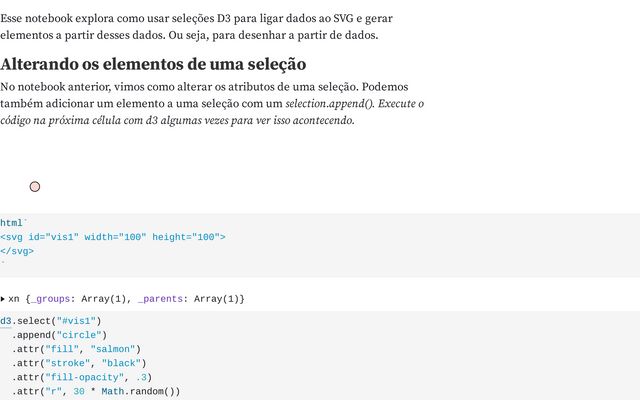
Criando as marcas a partir de dados
This notebook is a fork
Diénert Vieira
Nov 20, 2020
3.
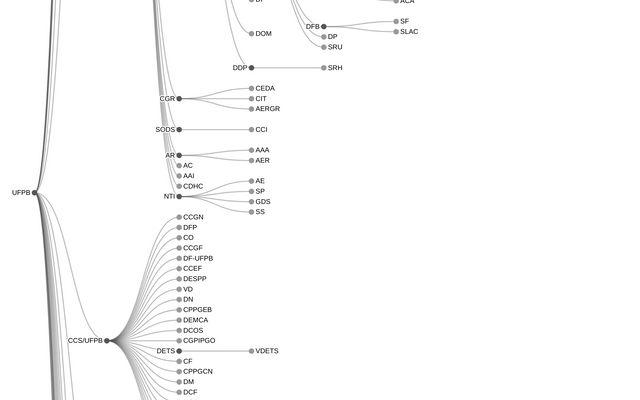
Estrutura Hierárquica da UFPB
Diénert Vieira
Nov 17, 2020
4.
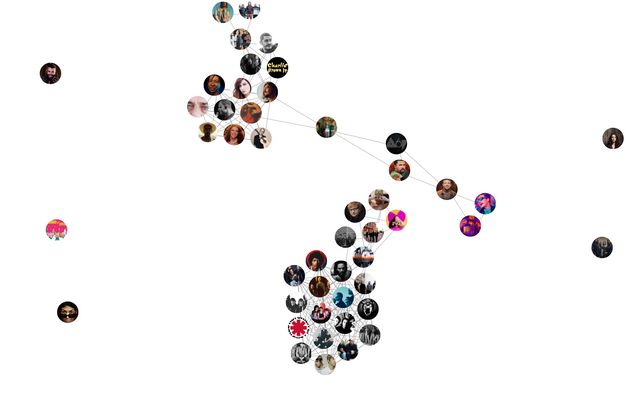
Navegando no que escutamos no Spotify
This notebook is a fork
Diénert Vieira
Nov 21, 2020
•
1
5.
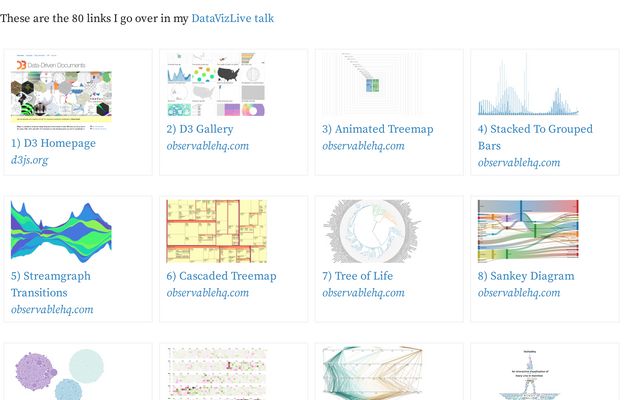
Touring the D3 Ecosystem
This notebook is a fork
Diénert Vieira
Nov 21, 2020
6.
Plotly.js Examples
This notebook is a fork
Diénert Vieira
Feb 15, 2020
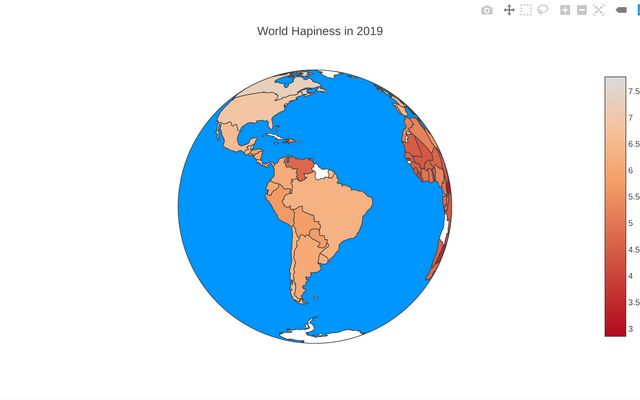
7.
World Happiness in 2019
Diénert Vieira
Feb 13, 2020
•
2
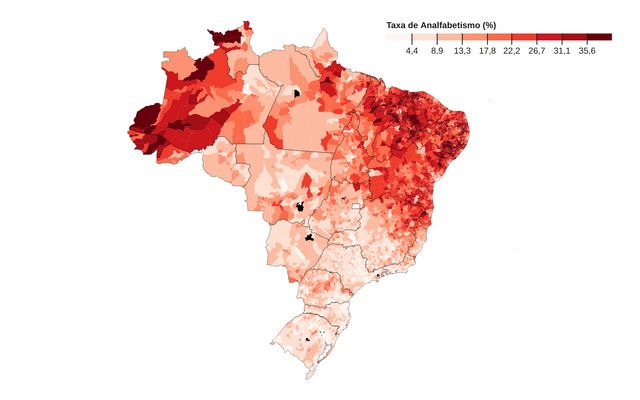
8.
Analfabetismo no Brasil por Município
This notebook is a fork
Diénert Vieira
Apr 11, 2019
•
20
9.
An Interactive Introduction to TensorFlow.js
This notebook is a fork
Diénert Vieira
Dec 17, 2019