Platform
Resources
Pricing
Sign in
Get started
Ed Hollingsworth
/
...
Public
Low Food Access
Visualizations Created for "HW4 - Exploring a Visualization Toolkit". The "Food Access" dataset from VT's CORGIS website was used for all Visualizations.
Showing all
5
listings
1.
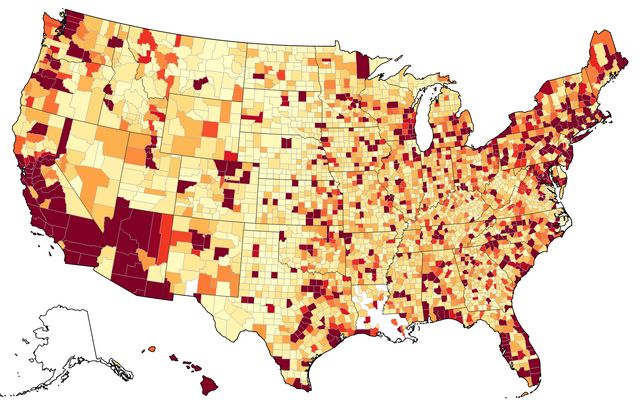
U.S. Low Food Access
This notebook is a fork
Ed Hollingsworth
Feb 10, 2023
2.
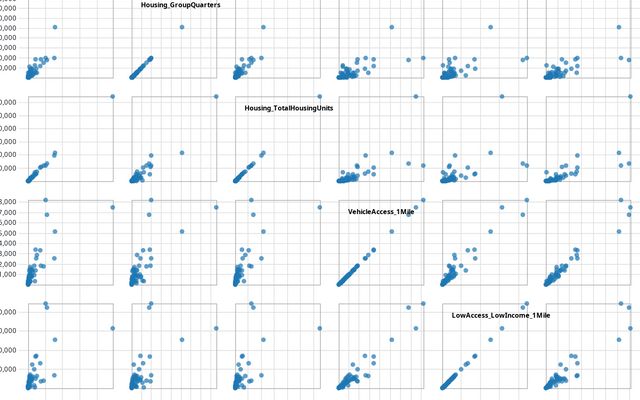
Low Food Access Scatterplot Matrix (California)
Ed Hollingsworth
Feb 11, 2023
3.
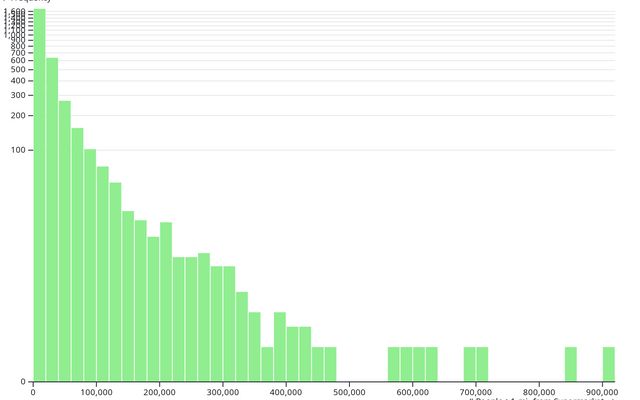
Low Food Access Histogram
Ed Hollingsworth
Feb 11, 2023
4.
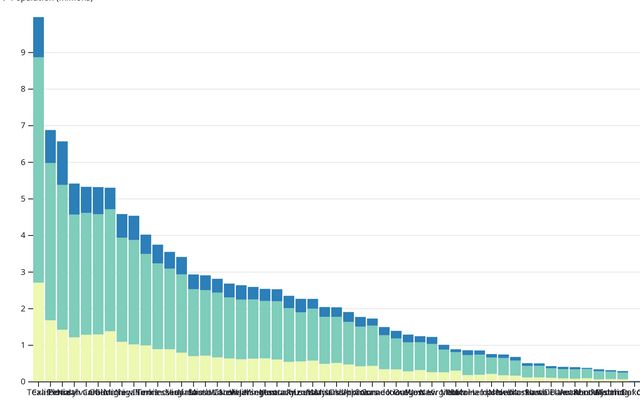
Low Food Access Stacked Bar Chart
Ed Hollingsworth
Feb 12, 2023
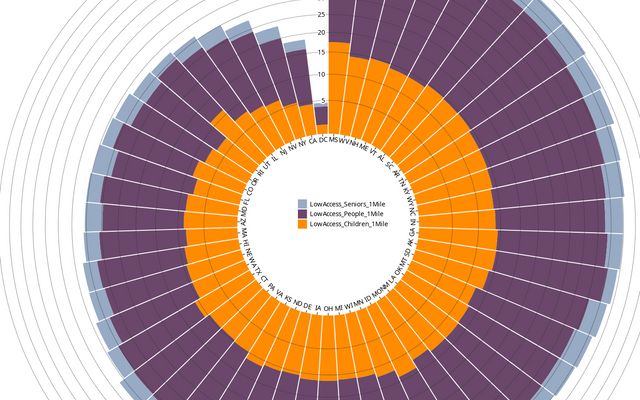
5.
Low Food Access Radial Stacked Bar Chart (%age)
Ed Hollingsworth
Feb 12, 2023