Platform
Resources
Pricing
Sign in
Get started
rogers078
/
...
Public
charts
Charts created using d3.js
Showing all
7
listings
1.
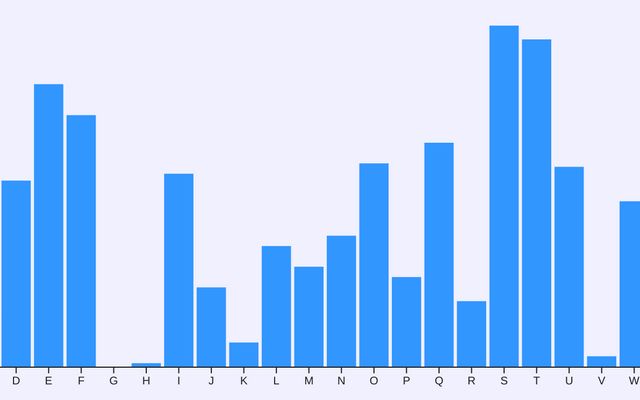
01. A Random + Modest Beginning - Bar Chart
rogers078
Mar 18, 2020
2.
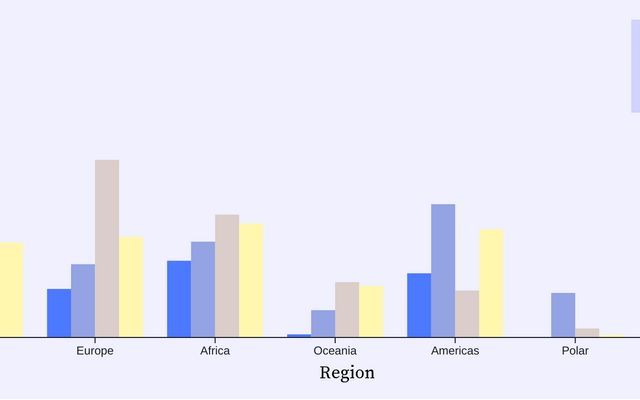
02. A Mapped + Nested Growth - #1 Grouped Bar Chart
rogers078
Mar 6, 2020
3.
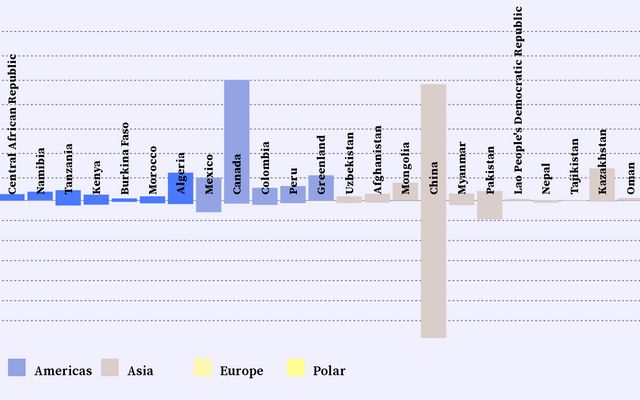
02. A Mapped + Nested Growth - #2 Axes Bar Chart
rogers078
Mar 9, 2020
•
1
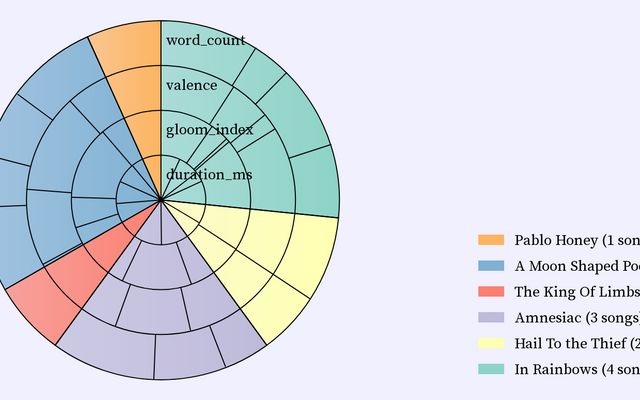
4.
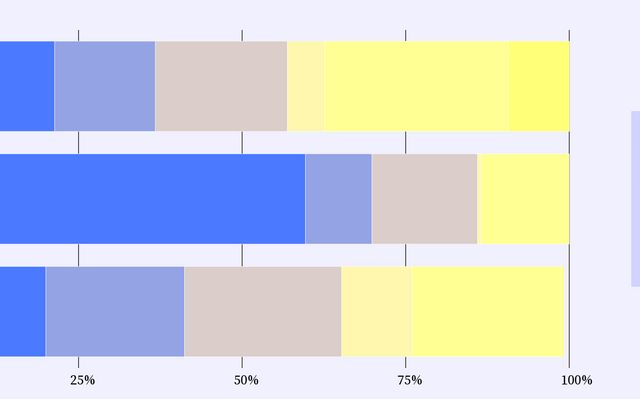
02. A Mapped + Nested Growth - #3 Stacked Bar Chart
rogers078
Mar 9, 2020
5.
03. The Numbers Guide The Paths - #1 Hybrid Chart
rogers078
Mar 10, 2020
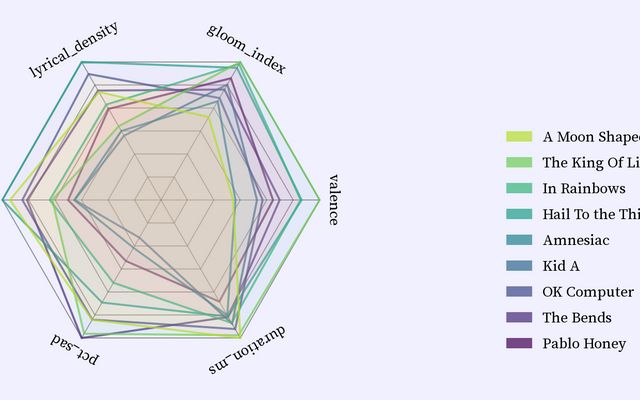
6.
03. The Numbers Guide The Paths - #2 Spider Chart
rogers078
Mar 10, 2020
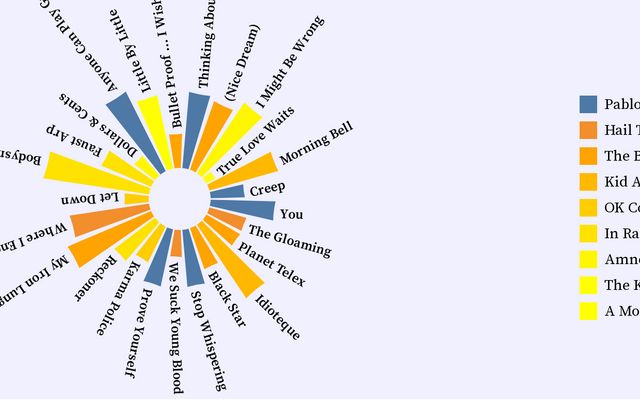
7.
03. The Numbers Guide The Paths - #3 Sunburst Chart
rogers078
Mar 18, 2020
•
1