• Pricing
  • Get started
Holger Stitz/...
Public

Build your first D3 bar chart

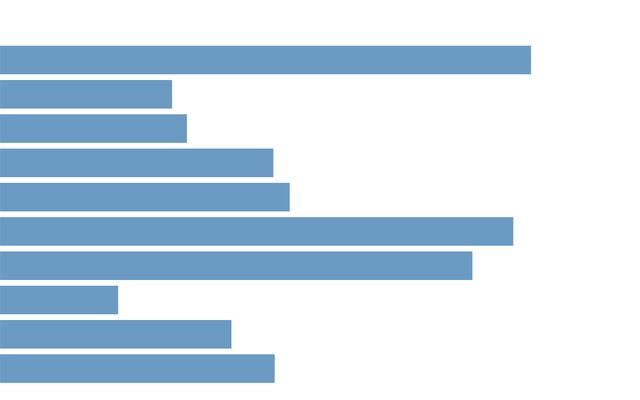
This tutorial develops your first D3 bar chart with animated transitions and filters step by step. The original was created by Samuel Gratzl and is available at github.com/sgratzl/d3tutorial. It has been adapted and extended for Observable.
Showing all 8 listings
1.
thumbnail
Observable Primer
The avatar for @thinkh
Holger Stitz
Dec 11, 2022•2
2.
thumbnail
Step 1: Simple D3 selections and manipulations This notebook is a fork
The avatar for @thinkh
Holger Stitz
Dec 11, 2022•1
3.
thumbnail
Step 2: Create nested elements This notebook is a fork
The avatar for @thinkh
Holger Stitz
Dec 11, 2022•1
4.
thumbnail
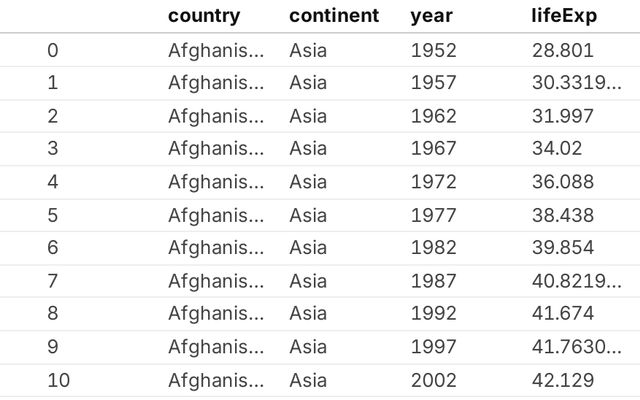
Step 3: Data loading This notebook is a fork
The avatar for @thinkh
Holger Stitz
Dec 11, 2022•4 2
5.
thumbnail
Step 4: Scales and axes This notebook is a fork
The avatar for @thinkh
Holger Stitz
Dec 11, 2022
6.
thumbnail
Step 5: Interactive filtering This notebook is a fork
The avatar for @thinkh
Holger Stitz
Dec 11, 2022•1
7.
thumbnail
Step 6: Animated transitions This notebook is a fork
The avatar for @thinkh
Holger Stitz
Dec 11, 2022
8.
thumbnail
Step 7: Final bar chart
The avatar for @thinkh
Holger Stitz
Dec 11, 2022
Platform
  • Observable Canvases
  • Observable Notebooks
  • Pricing
Docs
  • Observable
  • Observable Framework
  • Observable Plot
  • D3
  • Release notes
Resources
  • Blog
  • Webinars
  • Videos
  • Customer stories
  • Community Slack
  • Forum
Company
  • About
  • Careers
  • GitHub
LinkedInTwitterGitHubYouTube
© 2025 Observable, Inc.PrivacySecurityTerms of Service