Companies are struggling to make sense of market signals that could better inform investment decisions. The overwhelming amount of available data is causing companies to inadvertently overlook on-traditional data sources that could allow them to identify and effectively act on early market signals.
Meet Belo, an investment research firm serving a client base of institutional investors in the US and Europe, that is about to expand to a broader offering in Brazil. Through data analysis, media monitoring and consulting services, the firm provides important intel to make sense of data and help their clients make better investment decisions.
In order to obtain these early market signals, Belo chose to focus on alternative, non-traditional data sources (those that many investors may not consider) like credit card data, business processes processing and natural language processing. As Belo expands into other countries, they’re experiencing a growth spurt. With that growth, their goal is to decrease the time it takes to get meaningful analysis out to investors and they leverage Observable in order to speed up their time to market via faster dashboard creation and data visualization.
“The work we do is extremely time-sensitive. With Observable, we created our first client dashboard in a couple of days and realized that time savings is crucial when choosing the right tool for this type of work. We’ve made amazing progress in our data workflow over the past year using Observable. The platform allows us to explore data sources that many investors don’t have on their radar. By making sense of how it practically applies to financial markets, we give our clients an edge,” explains Paulino Oliveira, CEO and Founder.
Challenges
As Belo grows and strives to offer services that clients can use to make more savvy investment decisions, they recognize their own need to invest in the right data exploration tools. These tools need to allow them to meet tight deadlines and work quickly and in a collaborative way. After trying out some existing solutions, they learned what they were missing: version control, the ability to combine/merge projects, and the ability to have more control over visuals. They also wanted a modular platform that allows for fast completion of everyday tasks.
Prior to using Observable, the Belo Research and Productions teams struggled to deliver to their customers in a timely manner because they had problems with the workflow and collaboration - both were slow and inefficient. The Research team started working in Jupyter notebooks, but when it got to Production, they’d be forced to re-write everything, which costs valuable time. Now both the Research and Production teams write re-useable modules in Observable together, which are much easier to update. Observable is now Belo’s production environment and they’ve made amazing progress with their data workflow.
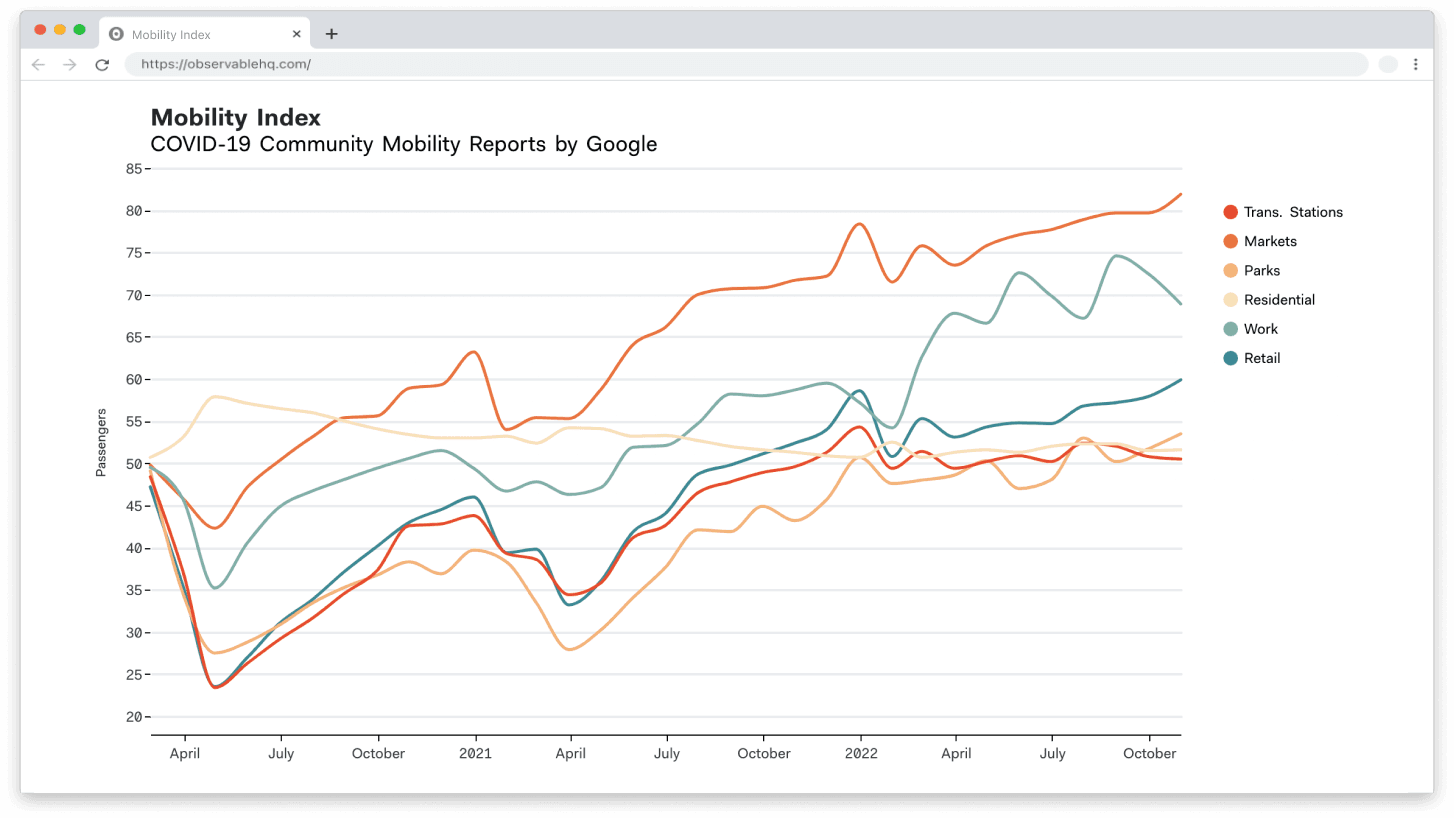
Foot traffic can be a good proxy for diverse financial indicators. In this case, Belo uses mobility data from Google to forecast demand for flights in Brazil, which can be achieved using aggregated data.
Multi-person collaboration improves speed
Lucas Borges, Data Visualization Developer at Belo, appreciates the ability to collaborate, saying it helps the team meet tight deadlines.
“It’s been helpful to use Observable for concurrent, multi-person editing on one notebook. Especially for time-sensitive reports; when we have to dig into a situation as it’s happening in real time. For example, with certain COVID data, we know there will be a broad effect on different investments. And we have tight deadlines. So, it’s been helpful for all of us to collaborate in one notebook - we’ve had much faster turnaround times working that way. It’s useful to have more people doing the development work in one notebook because we needed to create all the notebook charts at the same time,” Borges said.
Modularity expedites the work
Oliveira says that the modular nature of Observable has also helped his entire team work faster.
“We really appreciate the modularity of Observable. With lots of data tools, it’s very easy to get started, but soon, you’re hitting the wall. If you build something that you’re going to repurpose, or if you want to combine different visualizations, it starts to get complicated very quickly. Whereas in Observable, we can just import from different notebooks and repurpose existing work using other people’s code. This has expedited our projects significantly and we see a lot of value in that,” said Oliveira.
APIs replace timely ETL work, for cleaner data imports
By removing the time-consuming work that goes into ETL, Oliveira says that work is streamlined, and more efficient.
“Observable lets us remove the entire ETL (extract, transform, load) component. For instance, we were working with vaccination data in Brazil. That data is available two ways. First, as a .CSV file that can be downloaded directly from the government website. Second, it’s available on open databases. We can connect to those databases using Observable, without having to download the data and process it. We can do it all in the browser, which makes it much simpler. For COVID-related research where there’s a lot of online data sources, this connection makes a big difference in timing and ease of connection to large data sources,” said Oliveira.
No more getting stuck
Borges also noted that he’d like to emphasize the uniqueness of ... not hitting a wall.
“On Observable, there is always a way to create what you’d like; there’s flexibility. You can quickly adapt what you find in the JavaScript community or something coming from a different API,” he said.
Additionally, when he had questions about embedding his notebooks, he simply clicked over to the Observable forum. He noted:
“The forum is basically a knowledge repo and people there are very helpful. It was great to have that access to Observable experts. I also attended a few live Observable community meetups, which were helpful.”