About
IOP Systems is a startup that focuses on helping customers translate complex software performance metrics into actionable business outcomes. The company builds performance-specific monitoring and automated benchmarking tools to improve application runtime behavior so organizations can strike the most cost effective balance for maximum performance of cloud-hosted applications.
Yao Yue, co-founder at IOP, recognized early in her career a significant gap in how complex back-end software performance data was benchmarked and presented to stakeholders. With her background in infrastructure engineering, she realized that while back-end system performance data holds great value for businesses and decision-makers, it often remains invisible because it is complex and hard to visualize.
To tackle this challenge, Yao not only hired a visualization expert to build data products on top of infrastructure data, but also adopted Observable as a team to transform complex back-end data into clear, interactive, and actionable visuals that both engineers and business leaders could easily grasp and explore, bridging the gap between technical complexity and decision-making.
Proving out the value of data
Yao’s journey with Observable began before founding IOP while leading a team focused on supporting infrastructure, performance, and reliability of global operations at Twitter.
There, Yao’s team developed benchmarking tests and analyses for metrics like latency and throughput to optimize system responsiveness and resource allocation. Over the course of five years, their team (many of whom are now founding members of IOP Systems) saved Twitter over $100 million dollars through their innovative analysis and data visualization.
"During my time at Twitter, we needed to communicate sophisticated conclusions in a convincing manner to both business and engineering teams. The more compelling we could make the data story, the easier it was to get our point across. While our team had ample experience in software systems, we were severely understaffed in data presentation. Observable Notebooks were attractive for both visualization specialists and non-experts as a prototyping tool for this purpose."
- Yao Yue, Founder and Infrastructure Engineer at IOP Systems
Motivated by the success of those efforts and a shared passion for solving complex problems, the team embarked on their own journey in early 2023 by founding IOP Systems — and they brought Observable along with them as their go-to tool for data visualization and app development.
From prototype to production
IOP set out to create a performance testing and monitoring toolkit that could give organizations the insights they need to optimize application performance and resource usage through their flagship offering: SystemsLab.
While developing SystemsLab, IOP Systems uses Observable Notebooks as the locus for designing, prototyping, and iterating on their product’s end-to-end workflows. The malleable nature of the medium makes it possible for multiple team members to collaborate directly on the data schema and code, and iterate at the speed of thought.
"Observable provides an accessible way for us to approach data visualization," Yao shared. "We started IOP primarily using Observable Notebooks for internal prototyping. It was very refreshing to do all the development in the browser and see things right away."
As the project grew into a polished, customer-facing product, the team transitioned from Observable Notebooks to Observable Framework. "Framework became essential when we needed to move beyond prototyping," Yao said. "We quickly saw how powerful it could be for more complex, customer-facing projects. We could take what we had developed in Notebooks and convert or refactor into a full web interface that was clean, interactive, and ready for prospective customers."
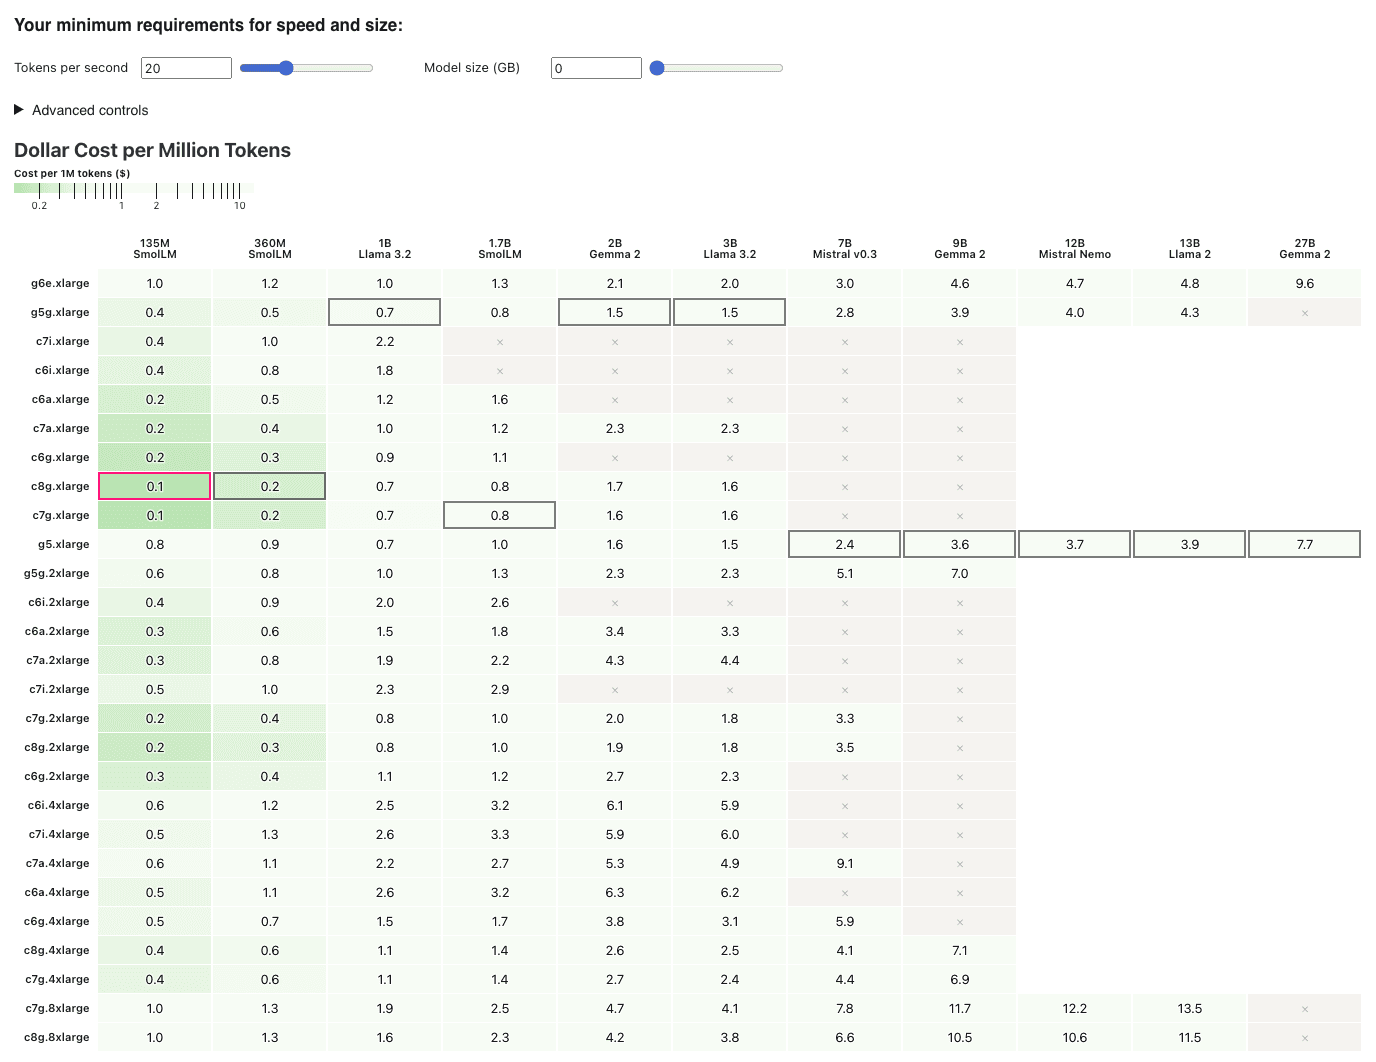
One essential component of the SystemsLab toolkit is IOP’s Framework-based ML inference cost optimizer, designed to optimize the cost of running small language models on AWS by identifying the most cost-effective cloud instance types.
Increasing team velocity with Observable
Observable offers a combination of accessibility and flexibility that was crucial for IOP. With a team composed mainly of back-end engineers, creating polished visualizations without deep front-end expertise was critical. "Most of us aren’t front-end or visualization experts, but Observable allowed us to present a polished product," Yao shared.
Yao shared that the Observable Plot visualization library was key to IOP’s speed and success during app development. "Plot generally has better defaults and looks more polished right out of the box compared to other libraries," Yao explained, which helped IOP efficiently build professional, business-ready visualizations with minimal customization.
Observable’s web-native design also made it easy to integrate these visualizations directly into their platform, bypassing many of the typical hurdles of using tools that are completely written in Python. "It just felt more natural to use Observable because it's built for the web," Yao explained.
Better, faster, scalable data app development
IOP’s journey with Observable showcases the platform’s ability to transform complex data into actionable insights, even for teams with limited front-end experience. With Observable Framework, IOP has been able to communicate back-end performance data in an engaging and interactive way, helping them build stronger connections with their customers and ensuring they stay ahead in the competitive infrastructure and performance testing space.


