The Marshall Project is a nonprofit news organization devoted to covering the criminal justice system in the United States. The system holds over 2 million people in confinement and, by some estimates, has affected the lives of nearly half of all Americans by the incarceration of a family member. The Marshall Project seeks to create and sustain a sense of national urgency about the criminal justice system through their journalism.
They use investigative, engagement, and data reporting to shed light on issues such as the use of force on children or people serving life without parole. On one such investigation, they used data from the Bureau of Labor Statistics to probe whether police officers were in fact leaving the force in droves as suggested by a public narrative. Their investigation uncovered that police employment decreased by less than 1% during 2020, while the overall US economy lost 6% of workers that year.
“We love these kinds of stories where there is a popular narrative but the data reveals something different. People read these and go to their city hall meetings a little more informed. They can ask better questions and engage with the narratives more effectively,” says David Eads, data editor at The Marshall Project.
The challenge of empowering everyone to interact with data
Data teams often hold a service-oriented role in the newsroom. They explore and analyze data and then they send their analyses back to reporters, editors, and other stakeholders. Eads believes in a more collaborative approach.
“We want to get out of a mindset where you go to the data people and they turn a crank and findings come out, but it inevitably leads to more questions. We really want to have collaborative exploration of data.”
For collaborative data exploration to work effectively, sharing must feel natural and part of the process. At the same time, the interface must be intuitive so that everyone feels empowered to explore data. “Tools like Google docs are great for sharing, but not ideal for working with data. Tools like Jupyter are suitable for working with data, but are not easy for everyone to read because readers have to dig past a wall of code before they can get to the charts or answers they need,” explains Eads.
Collaborative data exploration across the newsroom
“As journalists, we don’t promote products, but we are happy to talk about the tools we use, and we use Observable a lot,” says Eads.
With Observable, Eads and his team share data exploration tools and analyses with reporters and editors in the newsroom by simply sharing a URL. Since the notebook’s framework allows code and data to be interleaved with story, interacting with the notebook is an intuitive experience.
“By and large, our less technical collaborators have understood what to do when they pull up an Observable notebook and it has closed the gap between what our team does and what the rest of the newsroom does.”
When everyone is empowered to interact with data, everyone can participate in data exploration. On an investigation that revealed how Mississippi paid salaries for unfilled guard positions to a private prison company, there were multiple data sources to consider, including reports filed with the corrections department and monthly invoices, and answers were not readily apparent. Using Observable, Eads and his team were able to put all the data together in one place and use Observable’s Inputs (a set of built-in light-weight interface components) to slice and dice the data in different ways so that a team of reporters could explore the dataset and arrive at an estimate of how much was owed to the state.
“We all speak the same language about the data. We all share the same understanding about its limits and strengths. In our environment, having a shared mutual understanding is invaluable.”
Custom data exploration tools are practical and empowering
While collaborating with a reporter who was investigating the harassment of elderly Asians in New York, the data team was able to quickly build an interactive map of all cases. It empowered the reporter to explore the data herself instead of relying on the data team every time she wanted to try a different set of search parameters.
“It only took us a couple of hours to build on Observable. In other environments, building an interactive map like that would take too much time and effort to justify the return on investment.”
“Being able to quickly build one-off tools has been awesome for us. They are ephemeral, but they help us solve a problem really effectively. We don’t have anything else in our toolbox that gives us that level of flexibility,” says Eads.
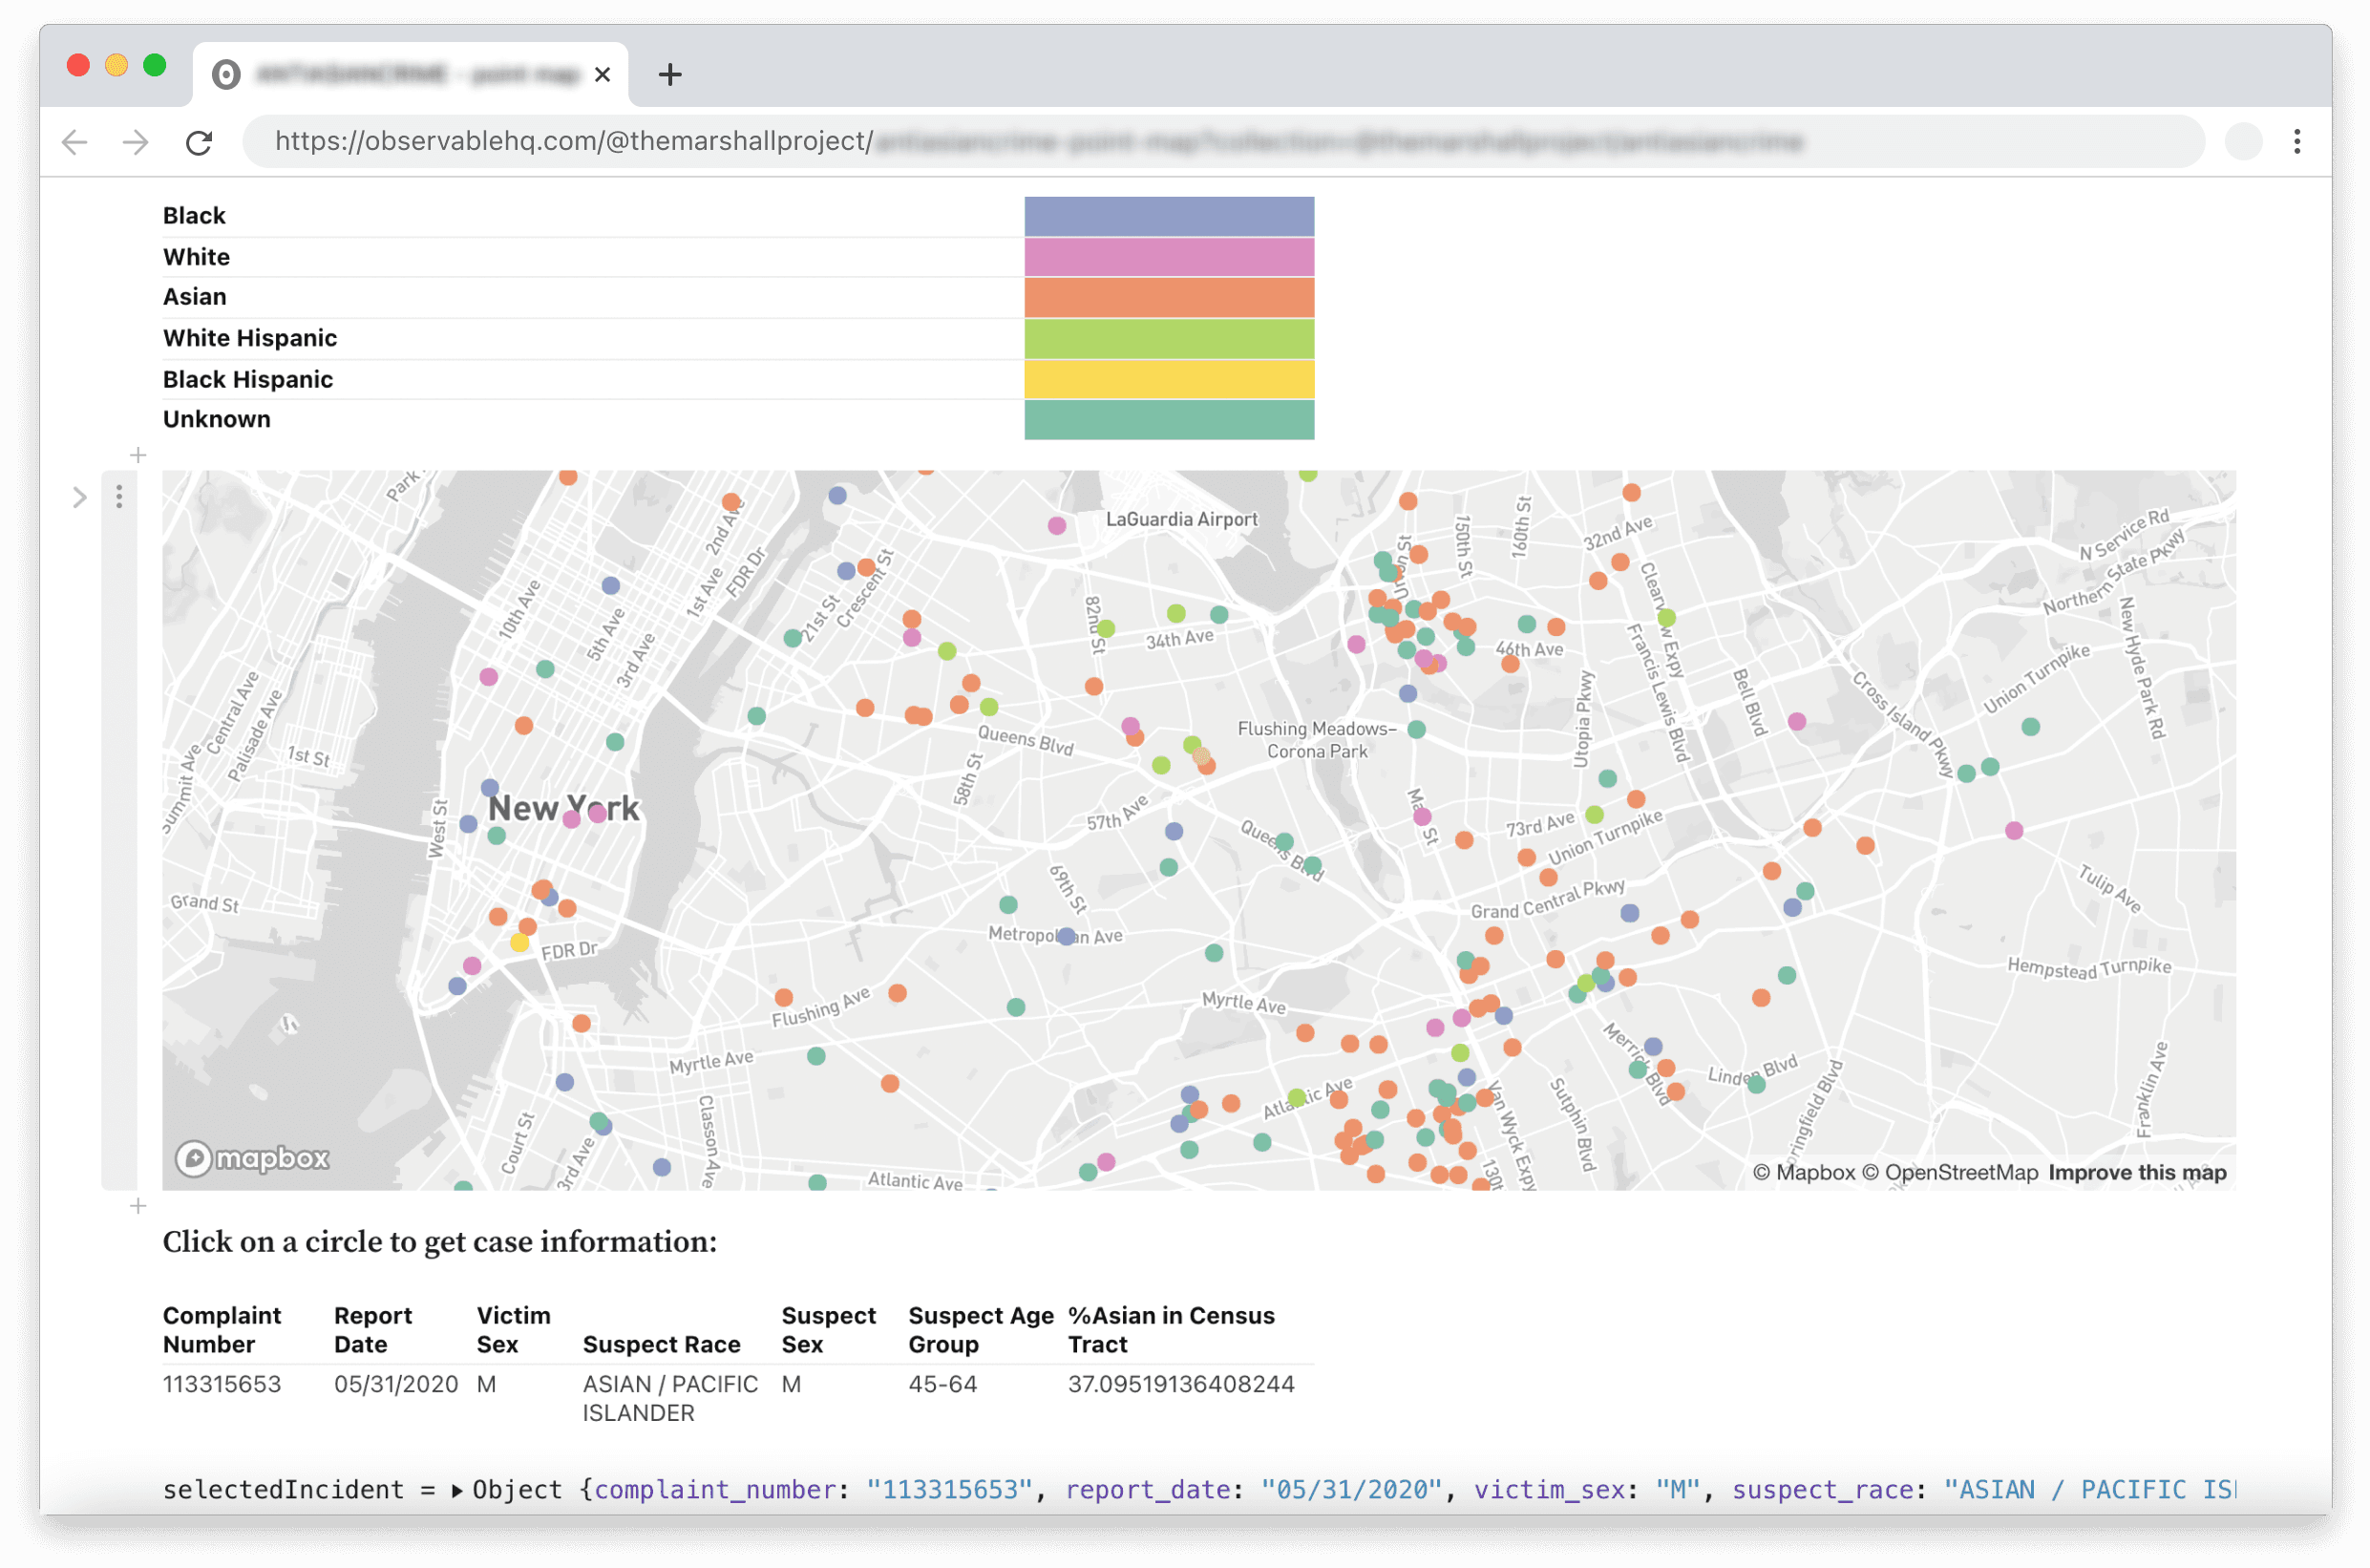
This interactive map of harassment cases in New York was quick an easy to build on Observable and it empowered the reporter to interact with the data herself and quickly find the information she needed.
Promoting transparency through published notebooks
By sharing their analysis notebooks with the world, the data team at The Marshall Project brings transparency to their work and empowers readers to interact with the data and engage with the process behind the story. For example, their story on people serving life without parole in Louisiana was published along with an accompanying notebook which included the analysis behind the narrative and anonymized data for readers to explore themselves.
“It has always been the case in my experience that working in public in this way has a very powerful way of holding bad faith arguments at bay.”
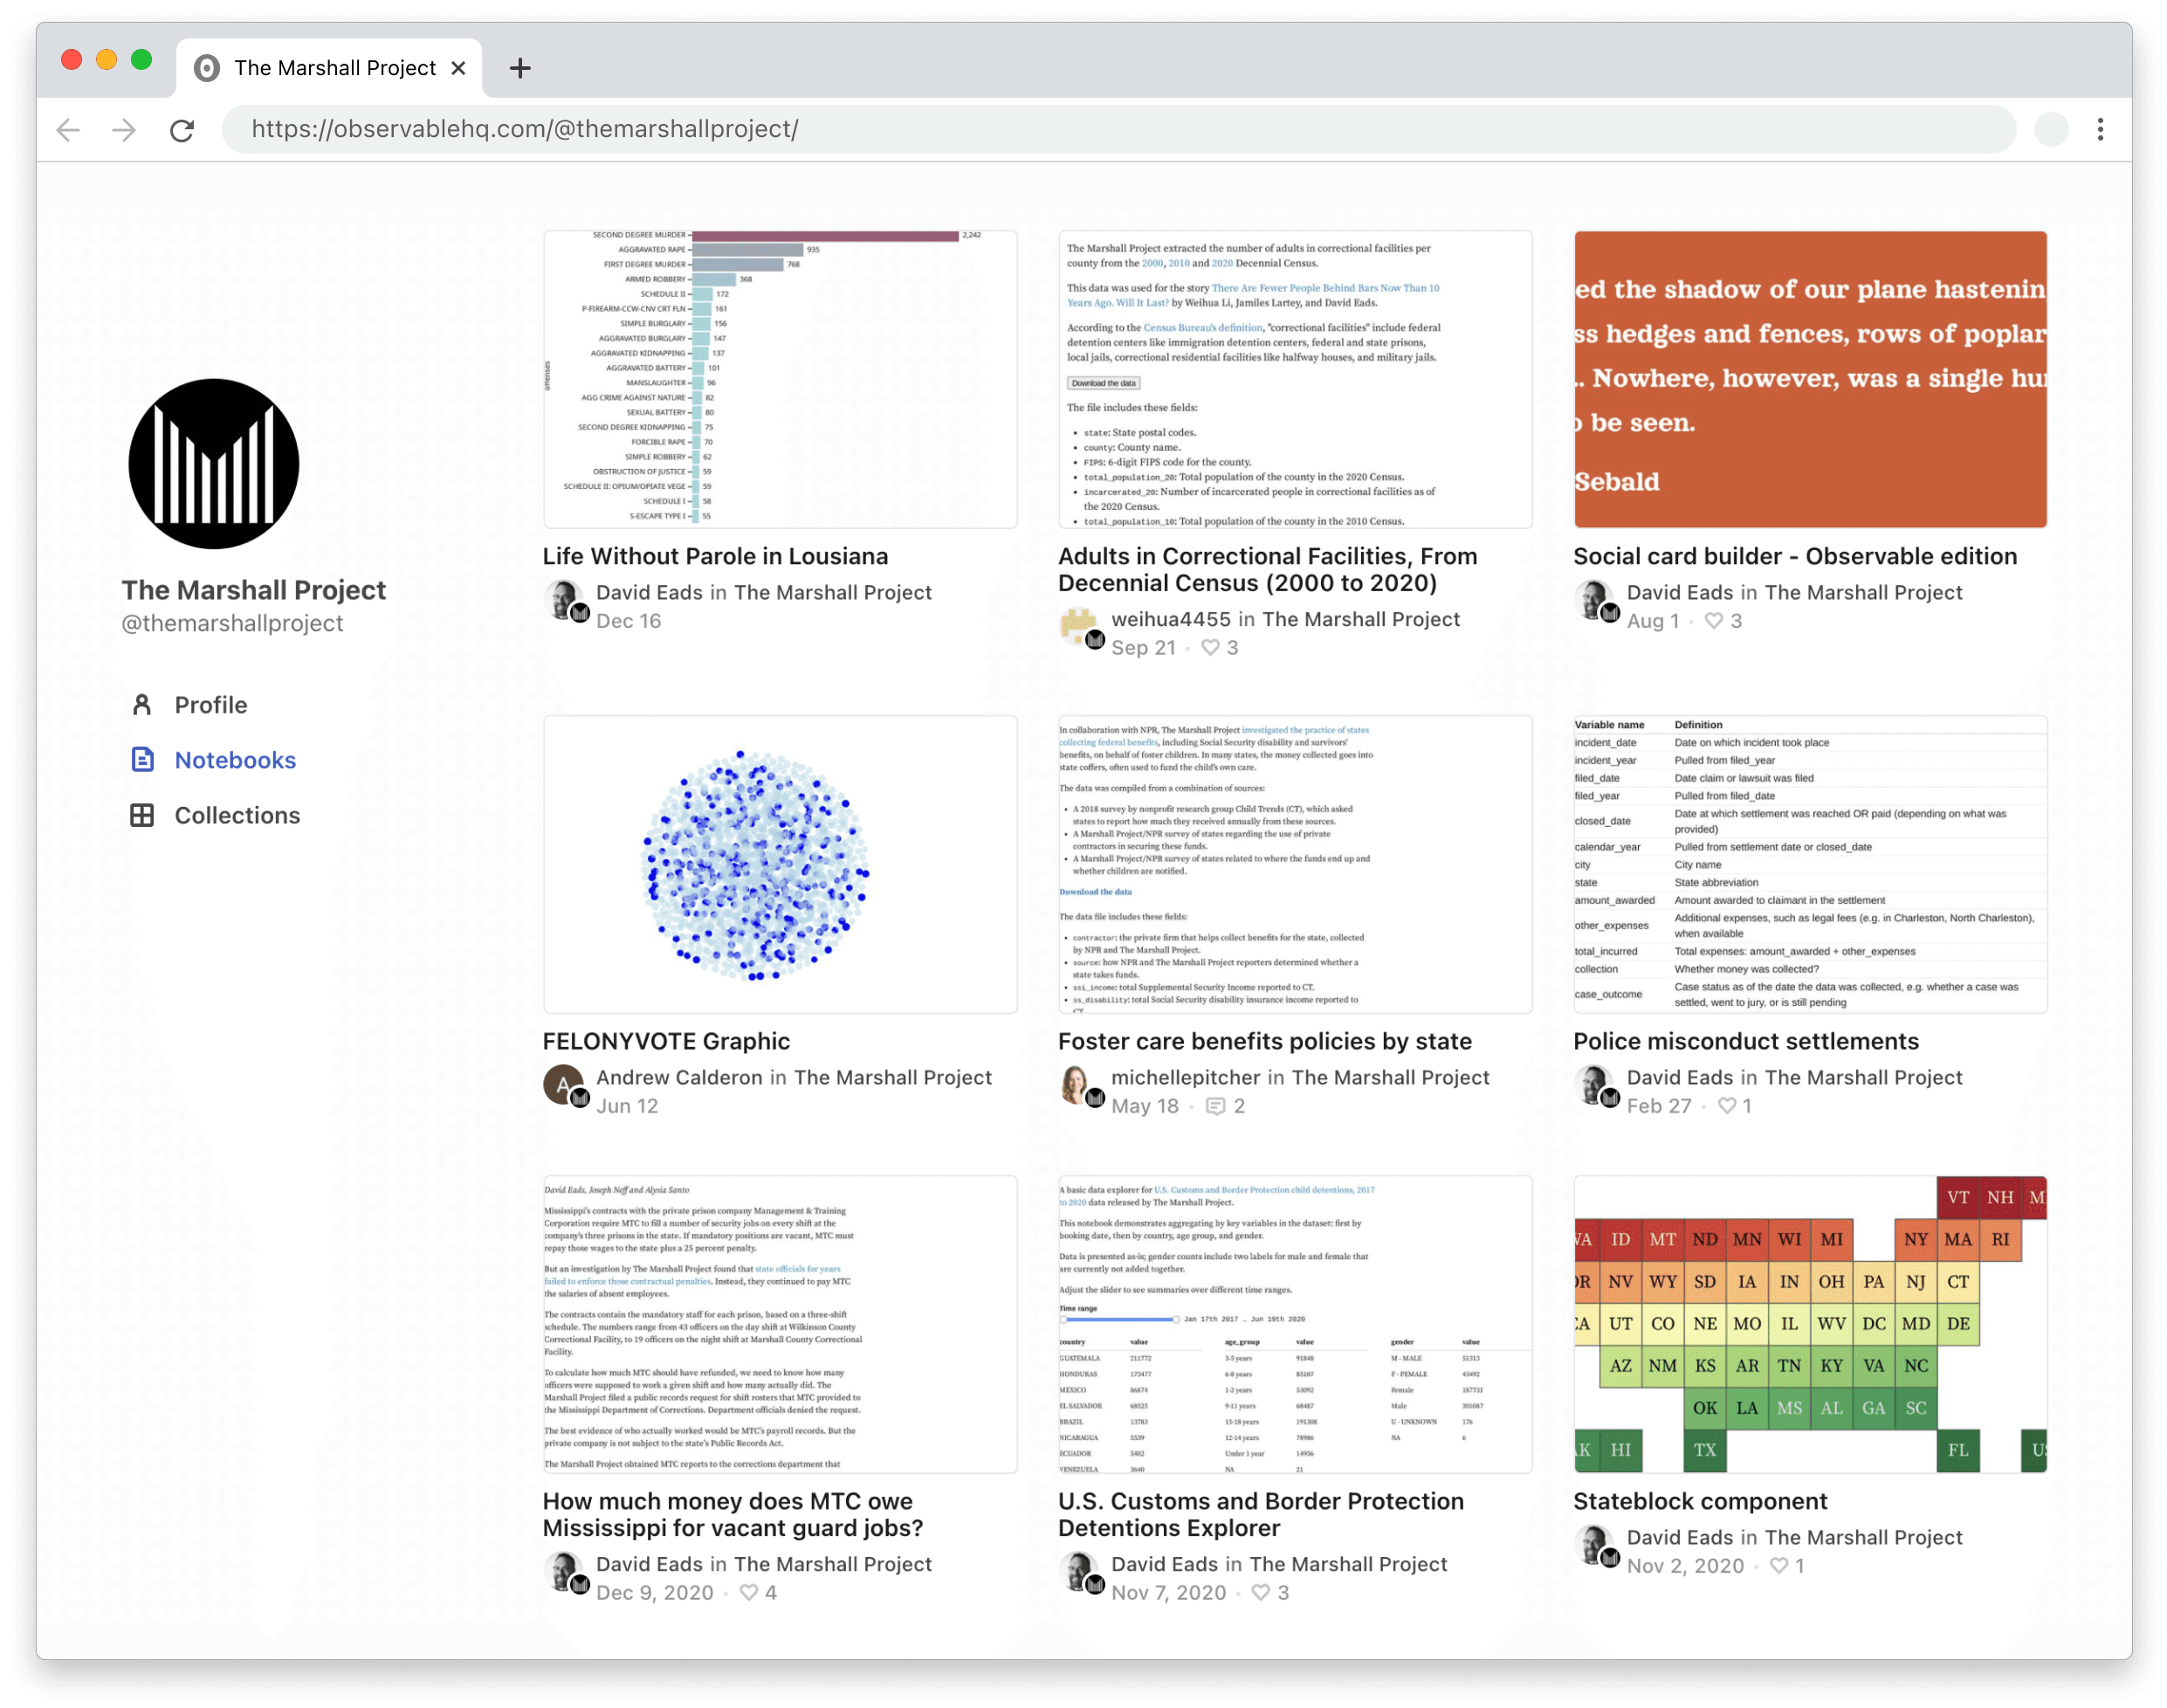
Notebooks published by The Marshall Project include several explaining the methodology and data sources behind their stories.
Enabling efficiencies across the workflow
With intuitive data exploration tools, reporters are empowered to explore and access the data they need, stories are written alongside data in the notebook and that makes fact-checking more efficient as well. “There have been many instances where collaborators were able to make edits themselves, were not interrupted while they were focusing on their stories, or were able to find new insights that others had missed,” says Eads.
“Since adopting Observable, the newsroom has been more efficient. I think we are going to be using Observable more and more.”