About
Trase was formed from a partnership between the Stockholm Environmental Institute and Global Canopy with a mission to increase the sustainability of how the world’s agricultural commodities such as sugar, beef, corn, palm oil etc. are produced, traded and consumed, and to reduce the level of deforestation tied to current unsustainable methods.
To do this, Trase surfaces data about global agricultural commodity supply chains and their impacts, revealing the links to environmental and social risks in tropical forest regions.
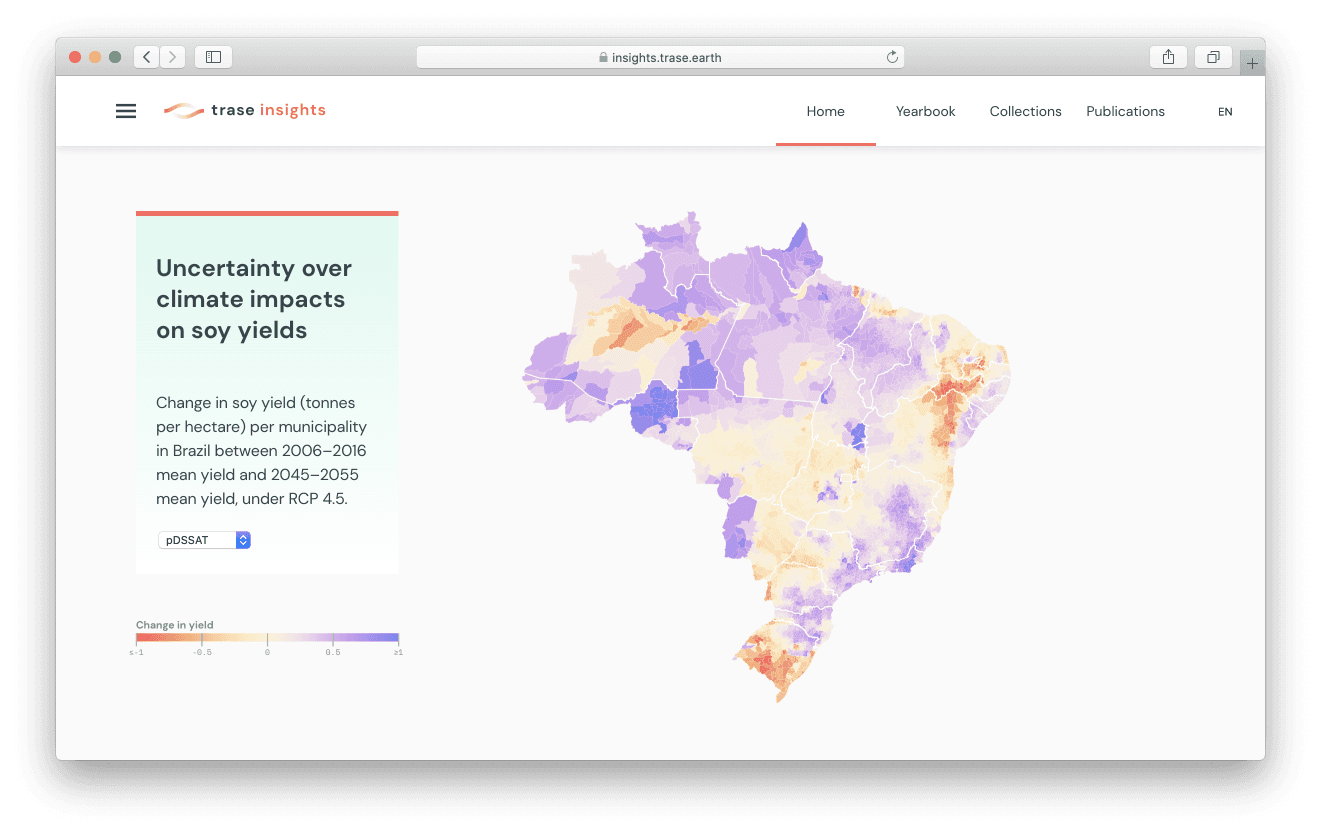
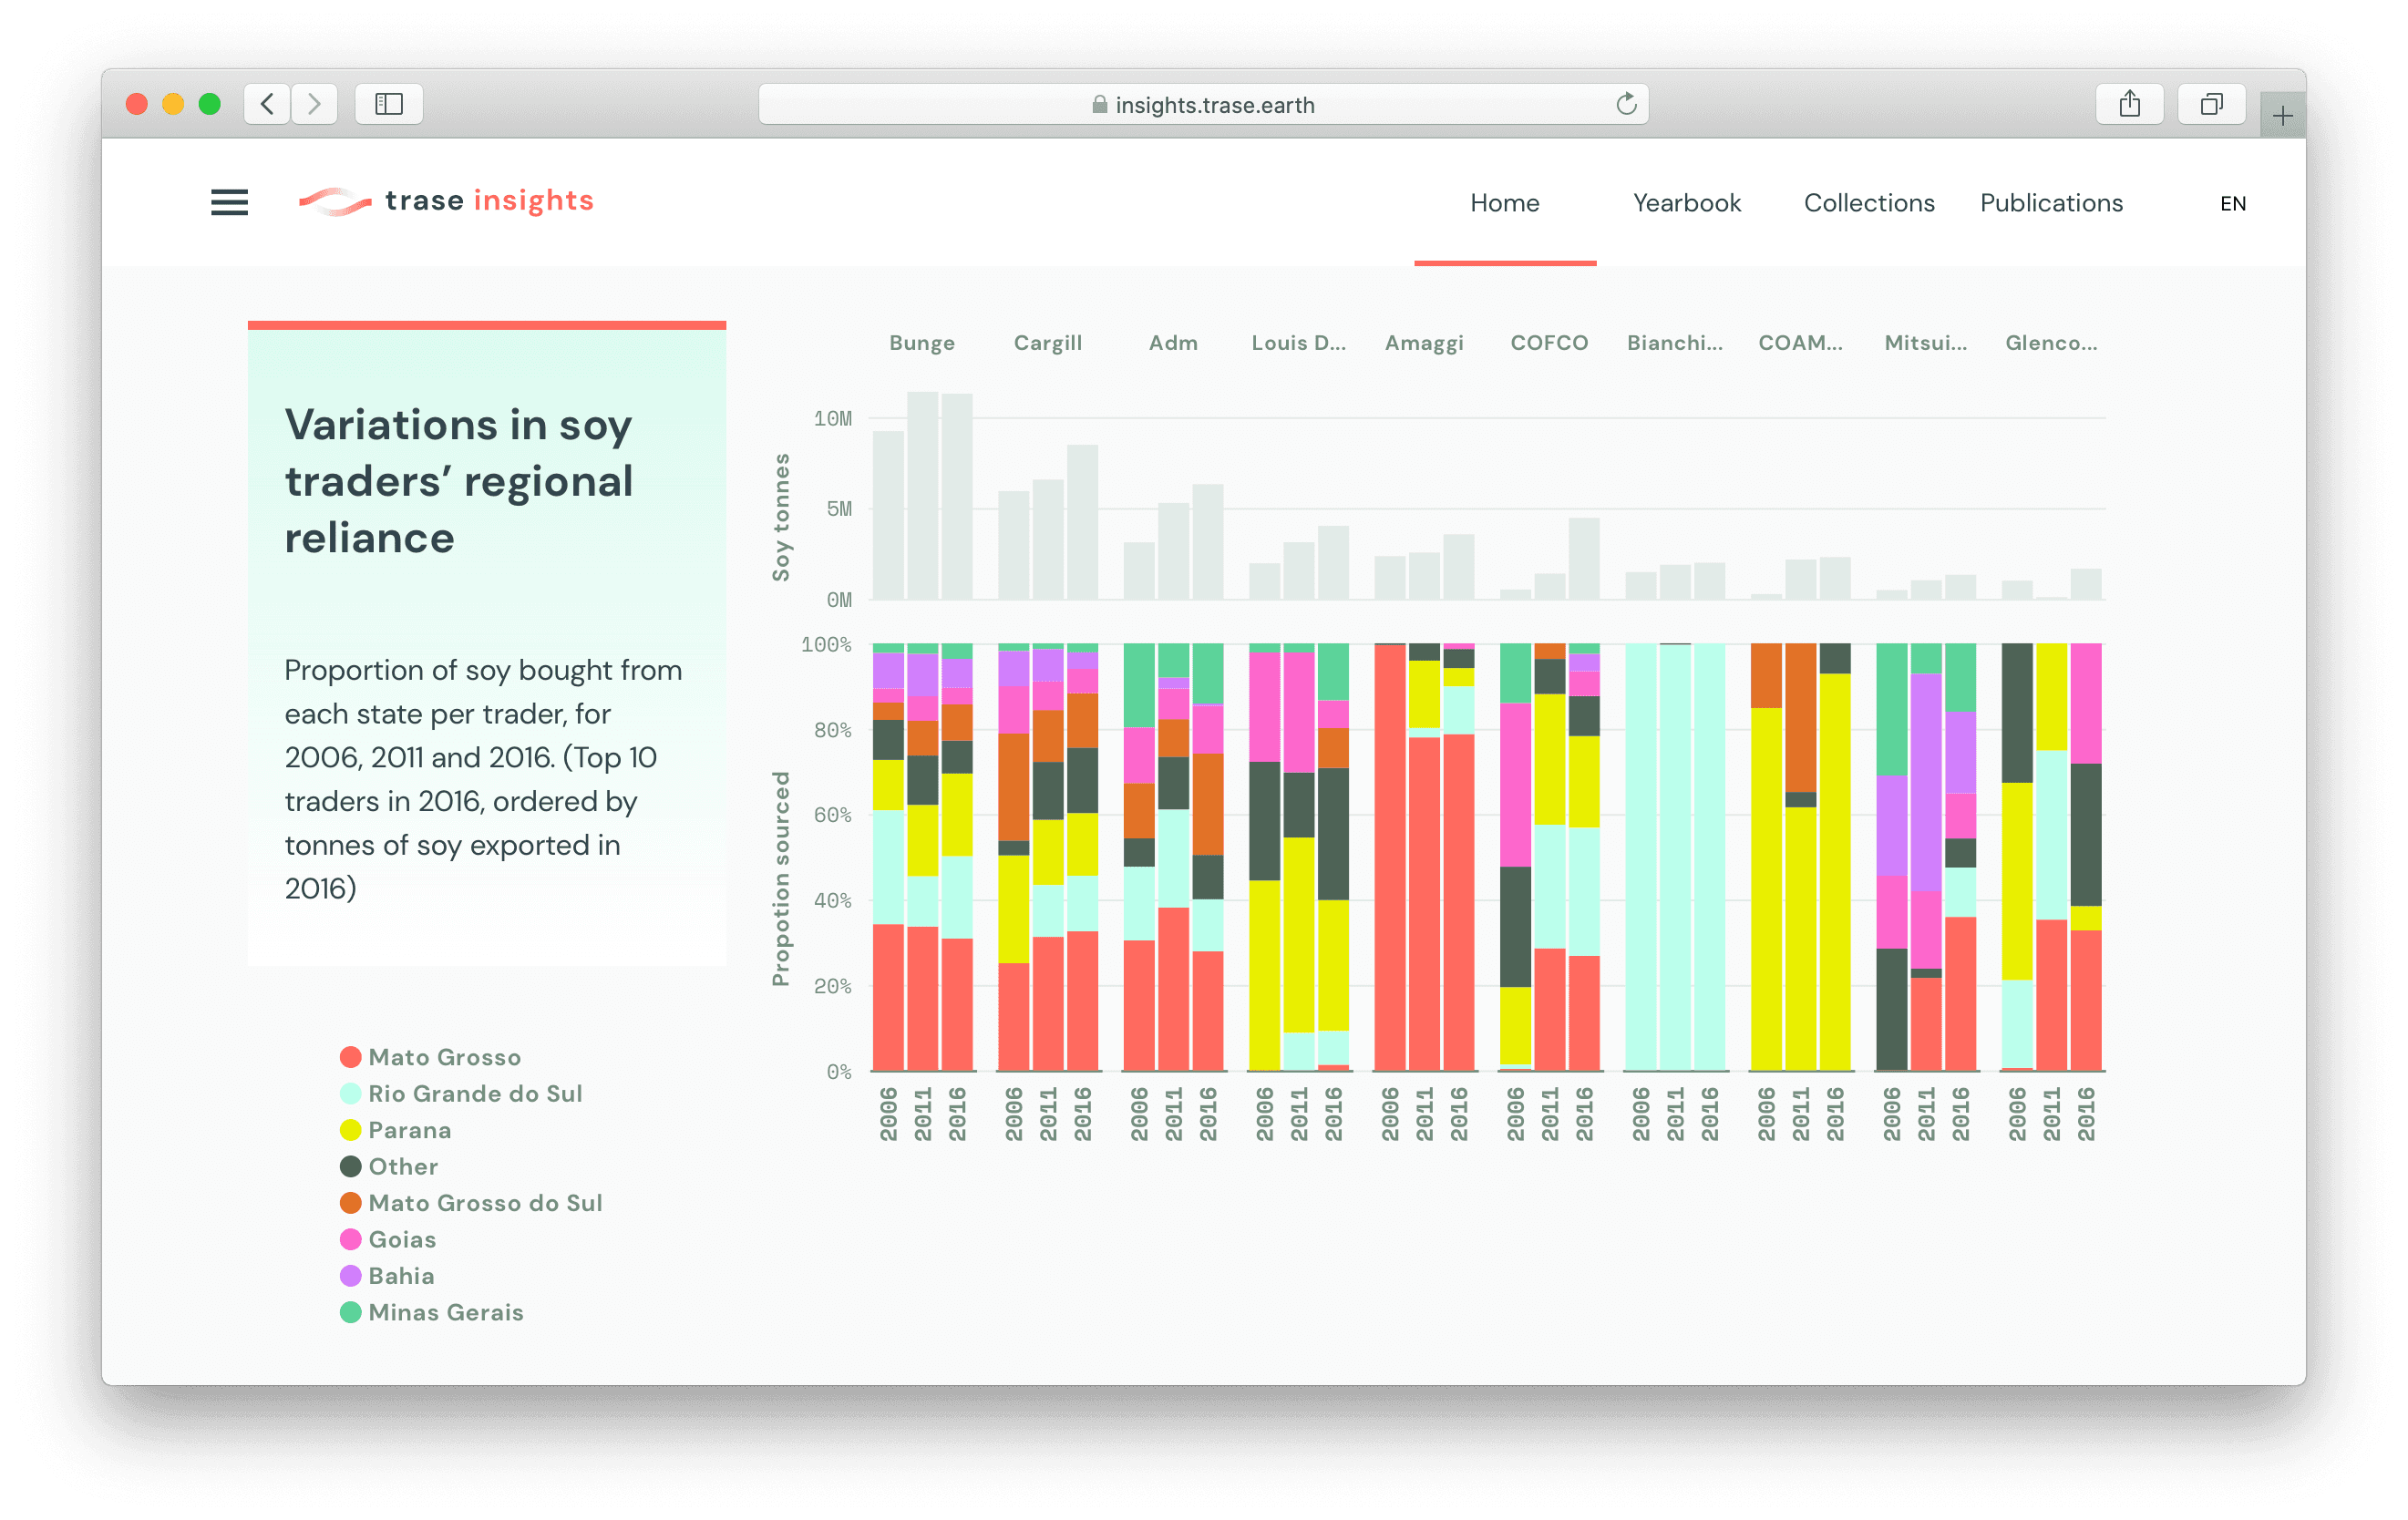
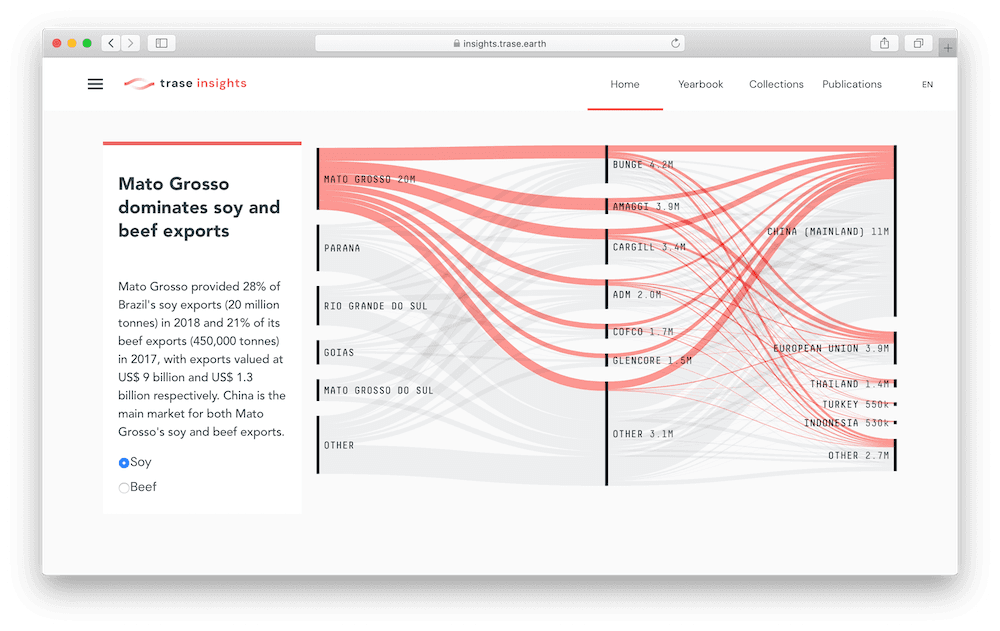
Consisting of more than 30 globally-distributed collaborators, Trase curates data from diverse sources around the world, consolidates and analyzes it, and then creates advanced visualizations and dashboards to inform their readers. They chose Observable to generate and publish live interactive visualizations on their website continue to update and republish them directly from their Observable notebooks.
Challenges
Prior to using Observable, the Trase team was spending a significant amount of time and resources making changes to their website and their yearbook. The system was expensive and difficult to scale, so the data scientists on the team looked for a different approach.
“Iterating on visualizations with external developers was proving expensive and slow, so I decided to create a few myself in a personal Observable account. It was from there that I developed a proof of concept for generating visualizations in-house, taking the financial burden off of our team and opening up the whole process,” says Ben Ayre, Research Associate at Trase.
Increasing productivity and optimizing impact
The team found the end-to-end experience with Observable, from prototyping to publishing in production, to be quick, easy and collaborative, without having to do several round-trip discussions with a third-party. As a result, they decided to do the visual design work themselves, and removing the vendor bottlenecks in their workflow. This allowed them to reduce costs and time-to-market of their data insights significantly.
“Observable provided the tools to easily stitch together previously disparate parts of our data visualization workflow. With Observable, we are able to create professional-quality visuals at a fraction of the cost we used to incur. So, what’s the cost of hiring a design firm? That’s the kind of cost savings we’ve seen by switching,” says Andrew Feierman, Data Scientist at Trase.
But cost reduction wasn’t the only gain the team saw - there were also huge gains in productivity.
“The amazing thing that happened was the level of productivity we saw - we hadn’t imagined it… We’re able to produce work that we weren’t even considering before we worked in Observable.”
Part of the productivity gains come from the ability for project team members to work together in notebooks in a private Team environment. This means no infrastructure to set up and maintain, no repositories to manage, and it is all available anytime, in live notebooks at the team members’ fingertips.
“The ability to collaborate actively on our data analysis and visualization has been a huge boon. It changes things completely when you’re able to see live updates in an accessible workspace” says Ben.


