TriNetX is a global network of healthcare organizations and life sciences companies driving real-world research to accelerate the development of new therapies. Through its self-service, HIPAA, GDPR, and LGPD-compliant platform of federated EHR, datasets, and consulting partnerships, TriNetX puts the power of real-world data into the hands of its worldwide community to improve protocol design, streamline trial operations, and enrich real-world evidence generation.
Challenges
“We wanted to show that TriNetX is the best choice for real-world healthcare data, especially for designing a randomized control trial targeting the right patients, and for generating evidence”, explained Bryan Farrow, the Director of Product Marketing at TriNetX.
Communicating the richness of their real-world data, in both breadth and depth, was critical. TriNetX needed a solution that showcased the wide geographic scope of the data and confirmed that all kinds of patients are well represented. It was equally important to emphasize that the data was not limited to just a few diagnoses or vital signs, but included years of clinical history, medications and other detailed information.
TriNetX chose Observable because it allows them to build customized interactive visualizations that showcase the scope and depth of their data in a way that captures the interest of their customers. It also provided them a path to publishing a curated overview of their secure and complex database.
Capturing interest by visualizing a complex database
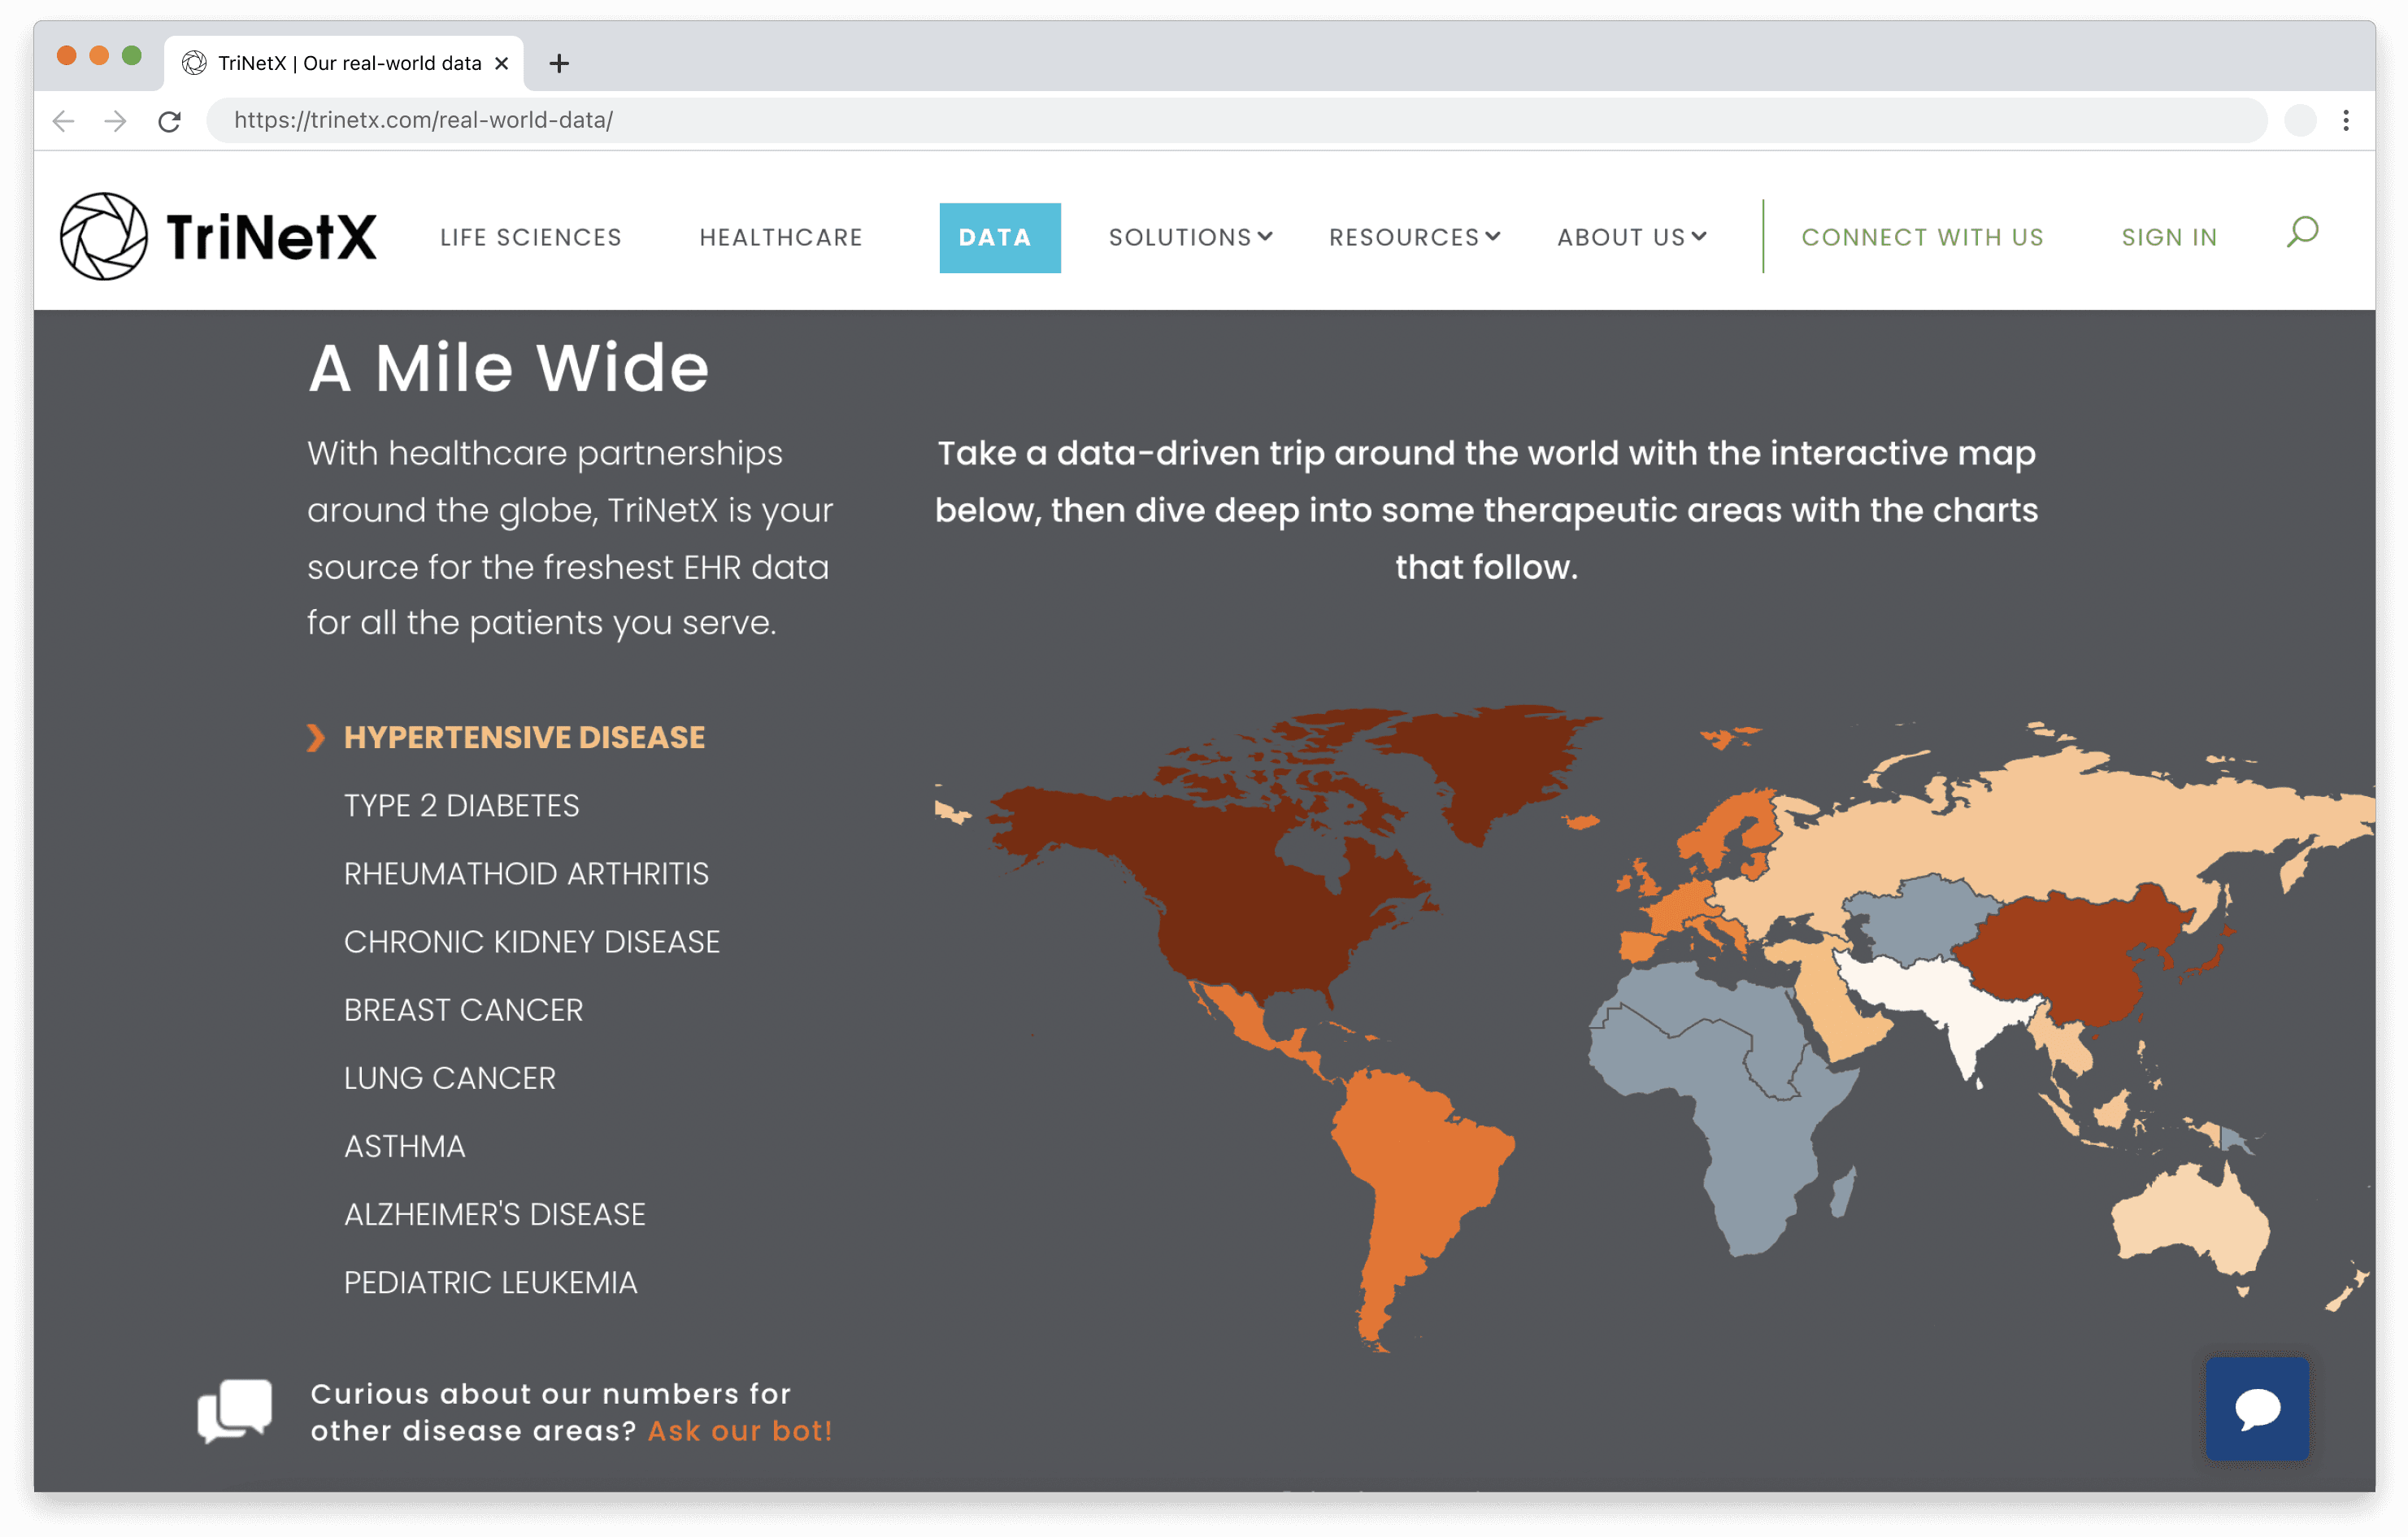
TriNetX wanted their customers to feel a sense of exploration as they peruse the website, so they built an interactive map that visualizes the origin of all their real-world data, over 250 million patient records, stratified by the history of disease. This visualization, embedded from Observable, allows their customers in life sciences and healthcare to understand patients around the world and conduct the trials and analyses that move medicine forward. As Bryan puts it, “With Observable we can let our customers visually explore the data and ask their own questions. It is a very compelling way to describe our offering.”
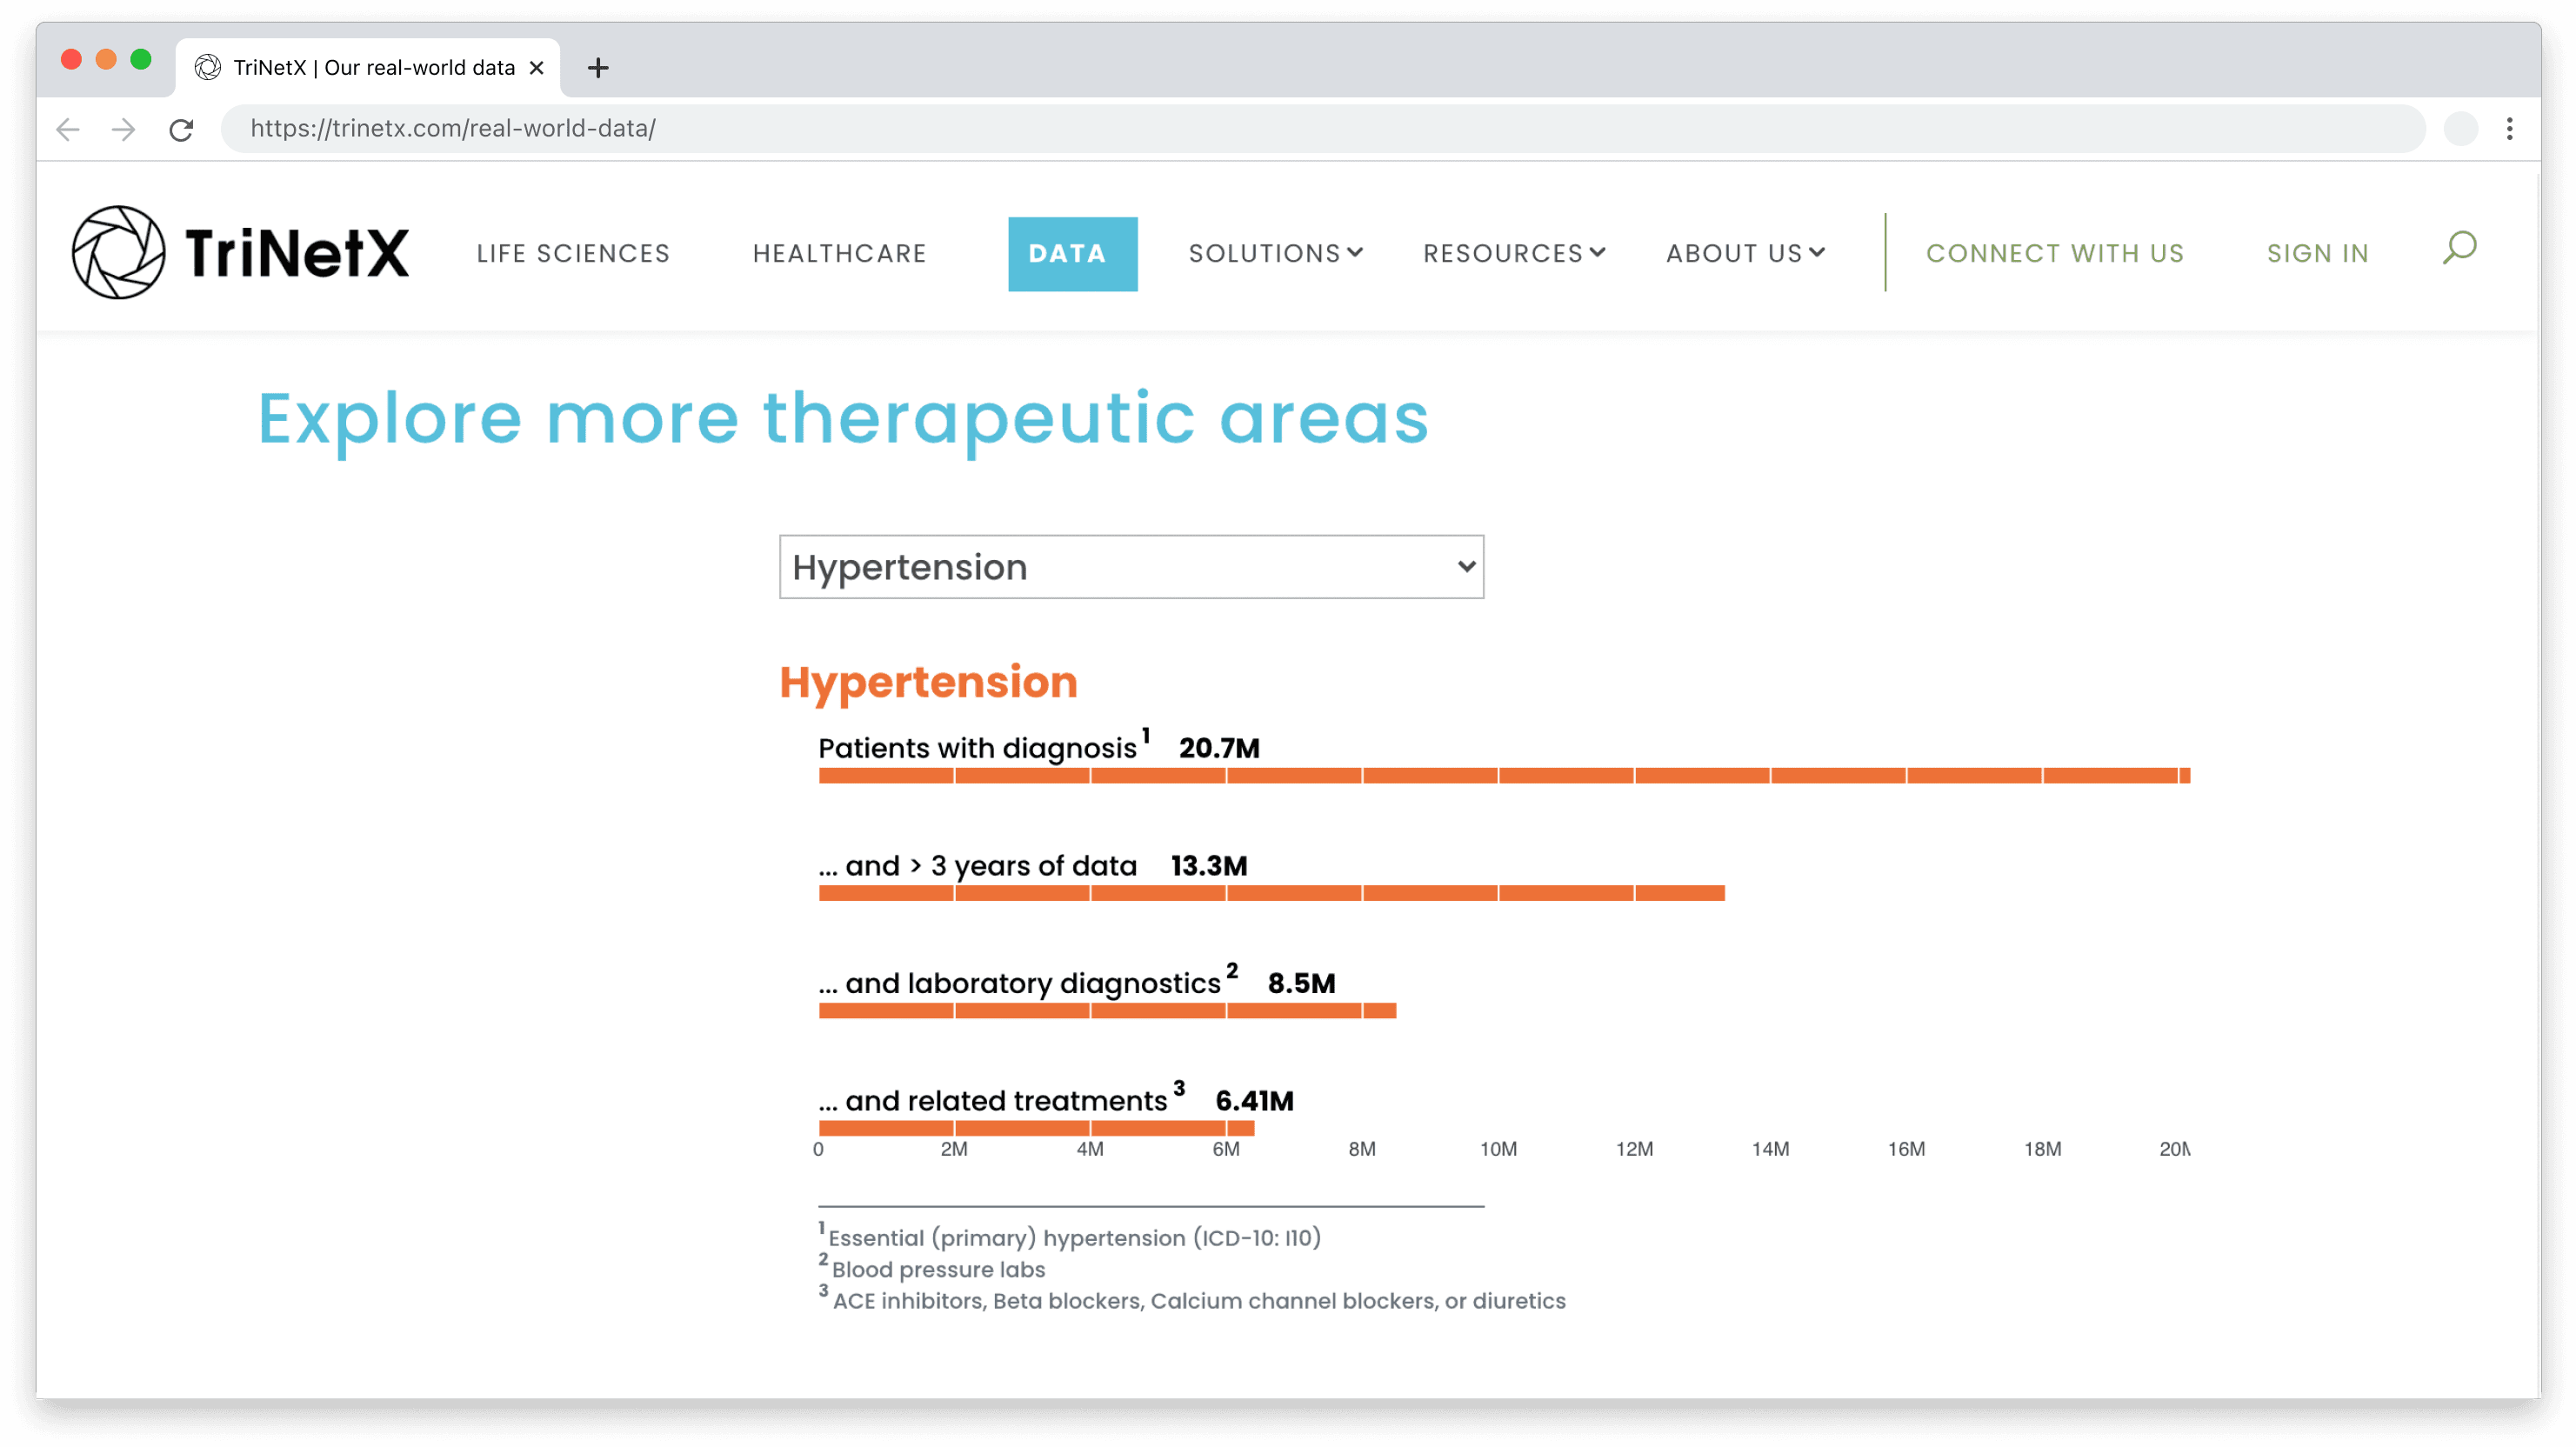
An accompanying visualization reveals the level of detail in each de-identified patient record. It conveys how TriNetX’s data offering can help their customers look beyond a disease history like hypertension, and dig deeper to see how many years of data are available, whether diagnostics like blood pressure measurements are included, and whether any related treatments like ACE inhibitors were used. Detailed patient records are key to understanding how treatments impact outcomes and these visualizations communicate the level of detail available on TriNetX’s data platform along with the sheer volume and geographic scope of the data.
A cost-effective solution
TriNetX invests heavily in storing their de-identified patient data securely. For a fraction of that cost, Observable allows them to celebrate the volume and richness of the data on their website, by providing a simple way to generate and embed powerful visualizations.


