Ed Hollingsworth
Public collections
Showing all 3 collections
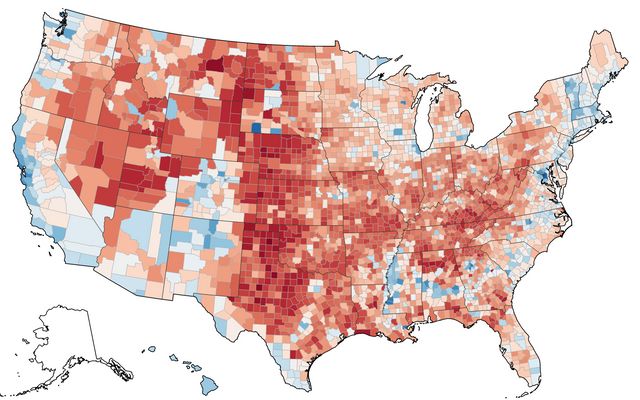
Different Ways of Visualizing Election Results on a Map
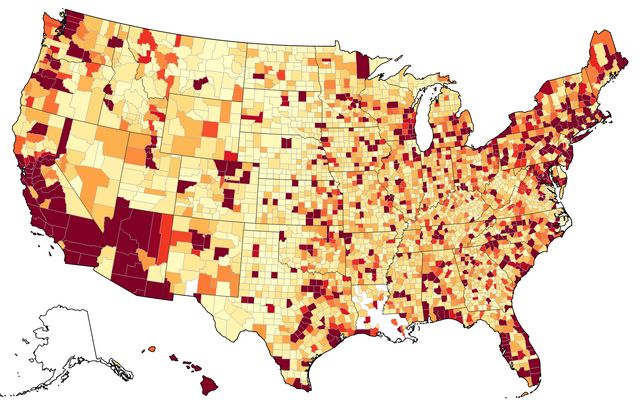
Visualizations Created for "HW4 - Exploring a Visualization Toolkit". The "Food Access" dataset from VT's CORGIS website was used for all Visualizations.
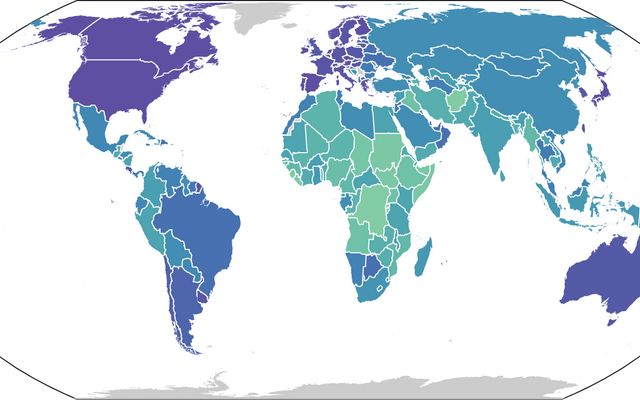
Visualizations Created for "HW5 - Persuasion through Visualization". The "State Fragility Index" dataset was used for all Visualizations.