Published
Edited
Mar 10, 2021
2 forks
2 stars
UK MPs' votes on BrexitDashboardN.J. use of force dataDashboardMarathon Training DashboardClustergrammer-GLInteractive Plot DashboardIn-Product Dashboard for your userCOVID-19 Live DashboardCricket DashboardDashboard with Brushing and Linking Example in Vega-LiteDashboardDashboard with bertin 🌍 & plot 📊Activity Tracking DashboardAWS HTTP Status Dashboard10 minutes dashboard: vegaSync guideAndy's Walgreens COVID-19 Tracker TrackerSVG DataGrid with many features and a live COVID Dashboard demo
W3DT Product-Market Fit Dashboard v1 (IPFS and Filecoin data separate)
Also listed in…
Finance and Strategy
filecoinHighValue = highValueUsers(filecoinStates, 'Filecoin High Value User Volume & Growth Rate', { showTrailing: true })
import { emoji, graphStyle } from '@protocol/transitions-v2';
import { inflowsToInactive } from '@protocol/inflows-to-inactive'
import { highValueUsers } from '@protocol/high-value-user-volume-growth-rate'
totalWeeks = 40
filecoinStates = (await fetch(`${filecoinGetStatesUrl}?start_date=${startDate}`)).json()
graphStyle
Purpose-built for displays of data
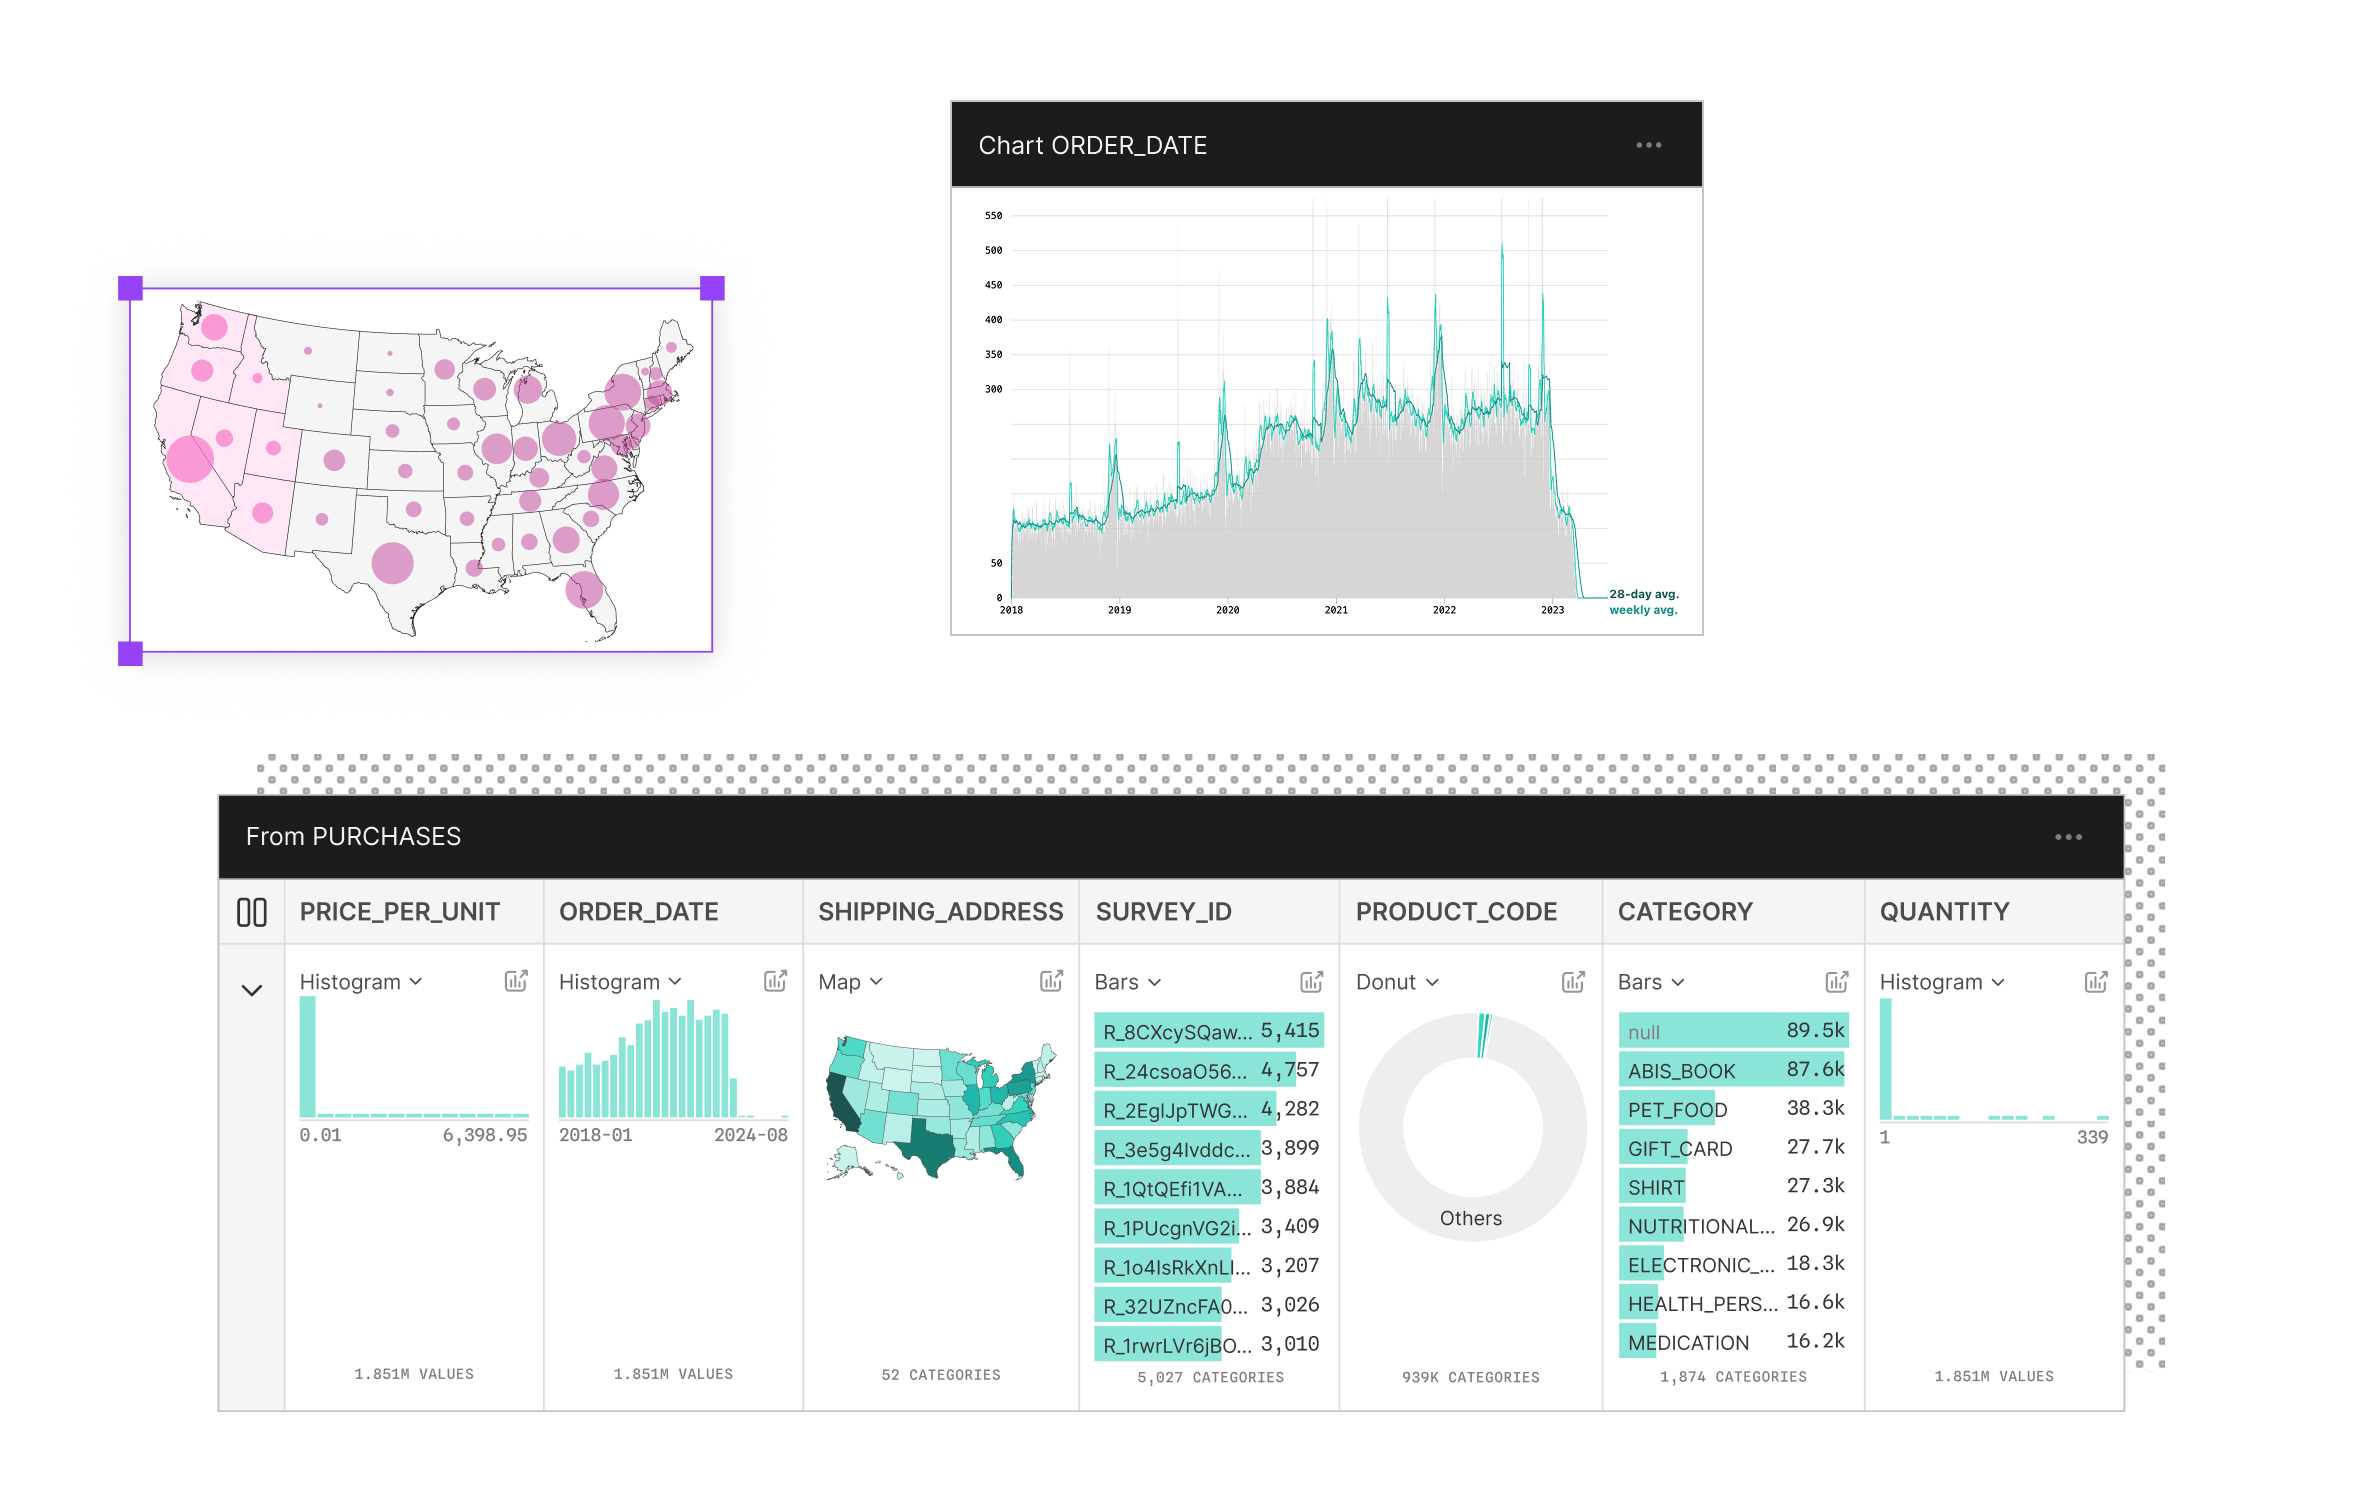
Observable is your go-to platform for exploring data and creating expressive data visualizations. Use reactive JavaScript notebooks for prototyping and a collaborative canvas for visual data exploration and dashboard creation.