Product
Learn
Community
Pricing
Search
Sign in
Sign up
Studio Data Vis & Mapping
Public notebooks
Public collections
Public notebooks
Sort
Title
Likes
Published
Showing all
12
notebooks
Week 3: Task Prompt
Studio Data Vis & Mapping
Mar 5
Week 3 Walkthrough: Observable Plot
This notebook is a fork
Studio Data Vis & Mapping
Mar 18
Week 1: Introduction to Observable
This notebook is a fork
Studio Data Vis & Mapping
Feb 14
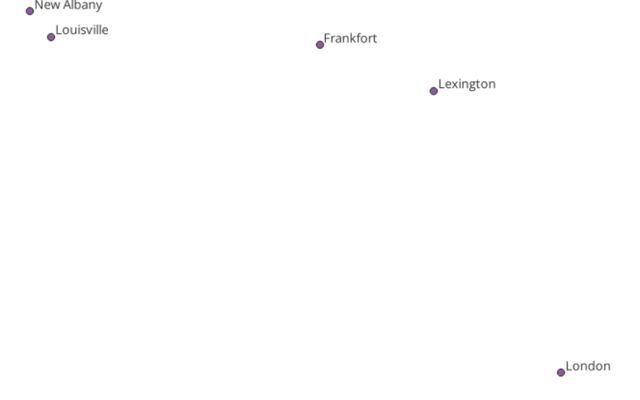
Week 5 Walkthroughs: Election Cartograms
Studio Data Vis & Mapping
Feb 13
Week 5: Task Prompt
Studio Data Vis & Mapping
Mar 25
Dougenik Cartogram of the 2020 Election by County
This notebook is a fork
Studio Data Vis & Mapping
Feb 12
Week 2: Task Prompt
This notebook is a fork
Studio Data Vis & Mapping
Feb 27
Week 2 Walkthrough: Cleaning Data with Excel
This notebook is a fork
Studio Data Vis & Mapping
Feb 27
Week 1: Task Prompt
Studio Data Vis & Mapping
Feb 20
Week 4: Task Prompt
Studio Data Vis & Mapping
Mar 19
Week 1 Walkthrough: Getting Started with Data Visualization and Mapping
Studio Data Vis & Mapping
Feb 13
Week 4 Walkthrough: The 2020 Federal Elections by State
This notebook is a fork
Studio Data Vis & Mapping
Mar 18