Observable Canvases are modern collaborative whiteboards for fluid data exploration and rich, interactive visualization. In canvases, we’ve implemented UI options for common data wrangling steps like joining tables, filtering rows, selecting columns, and deriving new values. But SQL is still the lingua franca of interacting with databases, and data analysts may need (or simply prefer) to write custom SQL instead of using our UI tools.
For that reason, we knew from the jump that canvases needed a SQL node where users could write and edit their own custom queries. While early canvas releases made it possible to write and execute SQL, it was far from an ideal user experience.
Over the past several months, we’ve made big improvements to the SQL node. Read on for a quick update on recent changes like syntax-aware autocompletion, better error handling, and UI adjustments that are improving the SQL experience in canvases, plus a preview of what’s coming next.
Dialect-aware autocomplete
Previously, users had to look outside of the SQL node to find functions, table and column names, and the correct syntax to use in their queries. From our own experience, we know that usually means too much time is spent troubleshooting, searching through documentation, and asking LLMs for suggestions in a separate chat. Our new SQL node autocompletion avoids those time-consuming side quests, helping you quickly build queries by suggesting table and column names, statements, and functions right in the SQL node as you edit:
Different databases can use slightly different SQL flavors. In canvases, autocomplete is dialect aware, helping you to build valid SQL queries for your database type.
Error handling
We also recently overhauled error handling in the SQL node for quicker troubleshooting. In earlier canvas releases, you could see that a query error had occurred, but there was no additional information easily in view to help you figure out what went awry — or where.
Now, error messages appear just to the right of your SQL code, and provide an interpretable description of what’s breaking while pointing to the exact line number where things went wrong.

UI updates
When you’re writing code, even seemingly small UI friction points can add up to a cumbersome experience. Over the past few months we’ve made a number of changes that smooth out previously rough edges in the SQL node, including several commonly requested by canvas pilot testers.
These include:
Variable editor width: You can now manually adjust the column width of the SQL editor, which is particularly helpful when you want to keep long statements on the same line.
Fewer clicks to get started: Previously, it took multiple clicks to start writing SQL in the SQL node. Now, with your node in Edit mode, just click once anywhere in the editing pane and start typing.
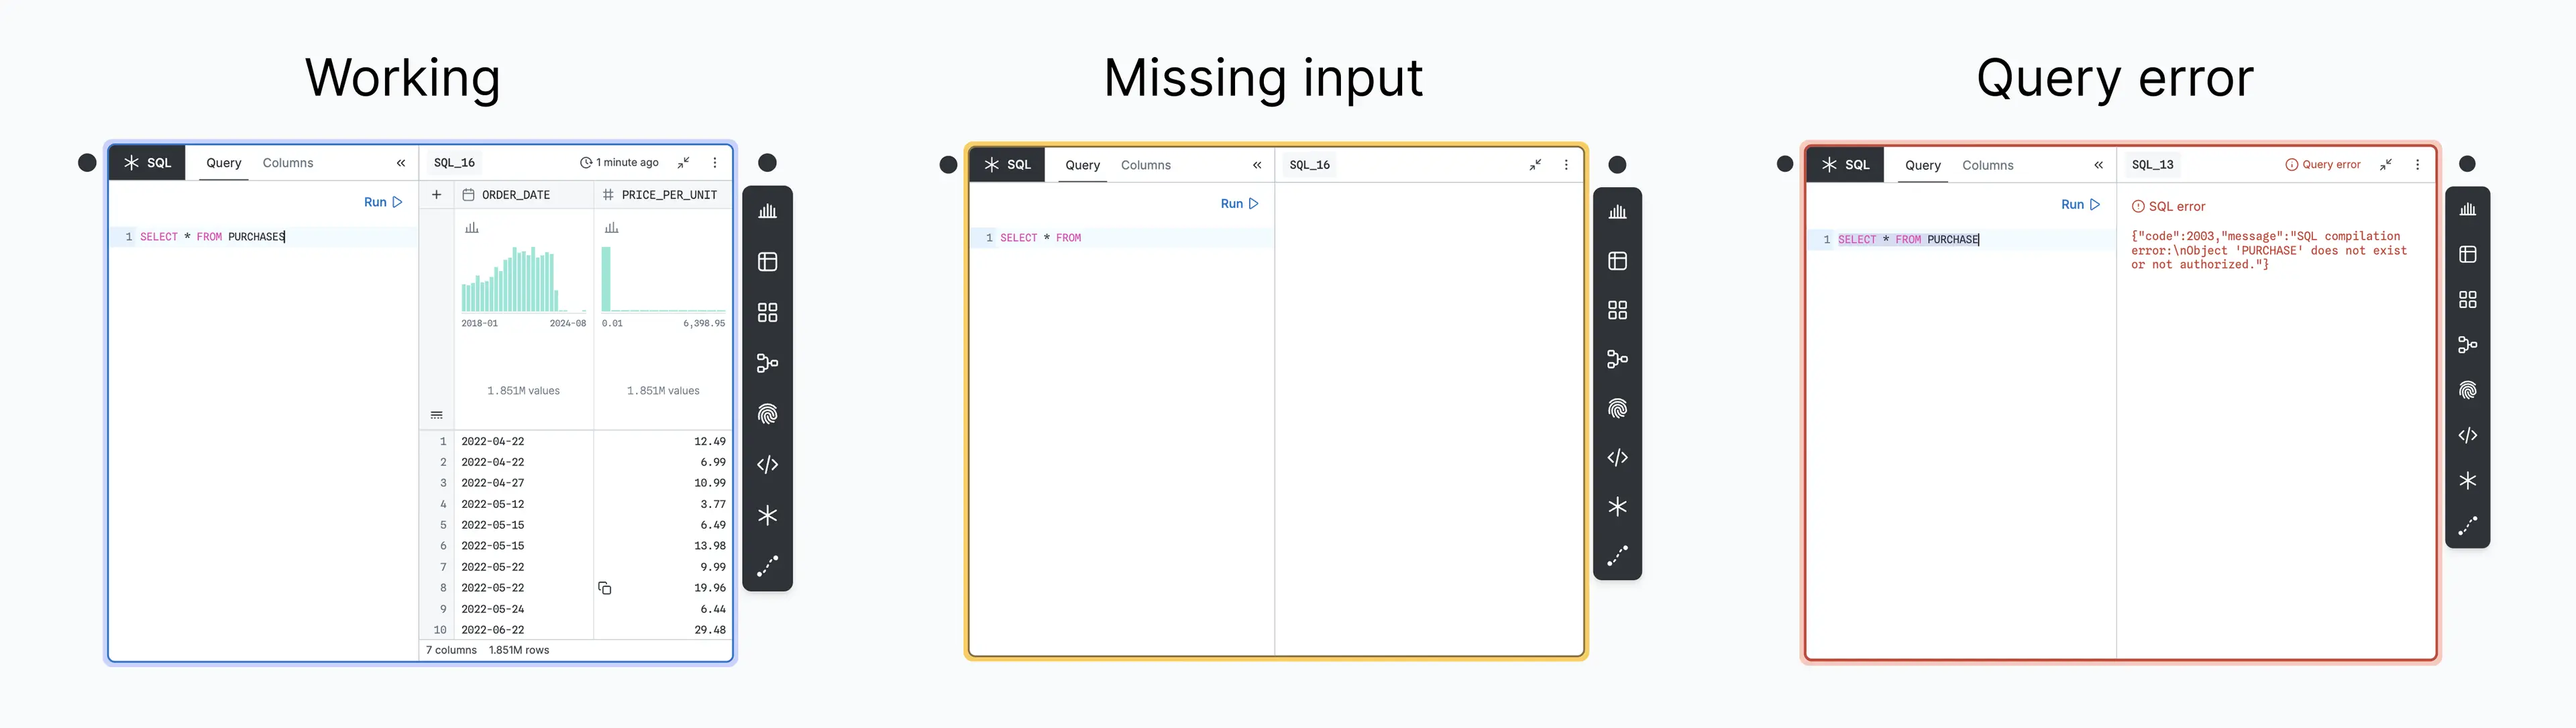
Status highlighting: You may have noticed the different node border colors in the visuals above. We recently added these visual cues for node status. With a node in Edit mode, the blue, yellow, and red outlines let you know if queries are successful, missing an input, or broken (respectively):
Coming soon: AI in SQL nodes
Update: The streamlined approach to AI in the SQL node described below is now live in Observable Canvases! Check out this post to learn how tight AI integration, AI-editable queries, and visual diffs make text-to-SQL even faster and easier to verify.
Updates to AI in SQL nodes are well underway, and will be available in canvases in early 2026.
Currently, Observable AI generates new queries in new SQL nodes, but it won't edit existing queries. This was by design: one of the original tenets of our AI was that it should not edit existing canvas content to avoid risk of AI making unwanted changes to your existing work. However, this approach has its tradeoffs. Adding a new node for each small change can quickly result in a large number of nodes cluttering your canvas, and bogging down performance, with unnecessary queries.
Observable Software Engineer Visnu Pitiyanuvath shares how we’re working to solve this issue:
What we're working on now is getting our AI to target a single SQL node. So, if you're working in a SQL node, you can ask questions or request changes just to that node. That way you don’t have to worry about anything else on your canvas being affected. We also want to make it easy to see what AI has changed in your SQL node, so we’re thinking of ways to show the difference.
Visnu Pitiyanuvath
Learn more
With Observable Canvases we’re making advanced, interactive data visualization possible for everyone — not just experienced developers. We also want canvases to be a hub for visual data analysis that brings analysts, data teams, and stakeholders together in one place.
Flexibility is a key part of that vision, which is why we’re improving both the SQL node and UI data wrangling options in parallel. While you could write SQL in canvases even in our earliest releases, recent updates like dialect-aware autocompletion, clear error messaging, and small but impactful UI tweaks greatly improve the experience.
As we keep building out canvases, check in on our release notes to stay up to date with what’s new. To learn more about canvases and to request a demo, click here.