Companies such as The Bill and Melinda Gates Foundation, UNICEF, and Ecotrust, rely on Periscopic to help them identify and shed light on important and impactful topics like gun violence, economic and gender inequity, public health and climate change.
With a focus on promoting data transparency and increasing public awareness, they work with their clients to identify topics and create data-driven stories to engage and educate in a way that anyone can easily understand. Recently, they worked with The Nature Conservancy to better illustrate how agricultural conservation directly impacts food production and even the health of the soil beneath our feet.
Streamlining workflows saves time and eliminates frustration
From the strategists that research and identify trends, to developers who build APIs and dashboards, to designers who ensure visually polished outputs — it takes a village to bring their insights to life and share them with the world. Cross-functional collaboration isn’t a nice to have, it’s a must have to get their jobs done.
Tool hopping during the iterative process and limited accessibility to previously used tools hindered important team input and slowed down the entire process. These were major roadblocks to effectively surfacing data-driven insights and it made explaining and presenting how they got the results to their clients difficult.
“Observable allows our entire team to work together in ways we previously didn’t even realize was possible. Multiple teammates - even people who don’t code - can co-create in an Observable notebook and provide direction via feedback and comments in real time,” said Wes Bernegger, Data Director at Periscopic. “We can easily share a work in progress via a simple URL and quickly provide input or make changes as a group. This saves a tremendous amount of development and design time and helps us collectively develop more cohesive stories on behalf of our clients.”
This improved workflow and ability to obtain input from a wider range of experts increased the quality of the work and the speed at which their team can create. Faster, more energetic collaboration between their data and design teams helps them better meet tight deadlines, while the expanded flexibility of Observable Plot chart types saves precious dev and design time.
With increased productivity and collaboration, Periscopic was up to the challenge
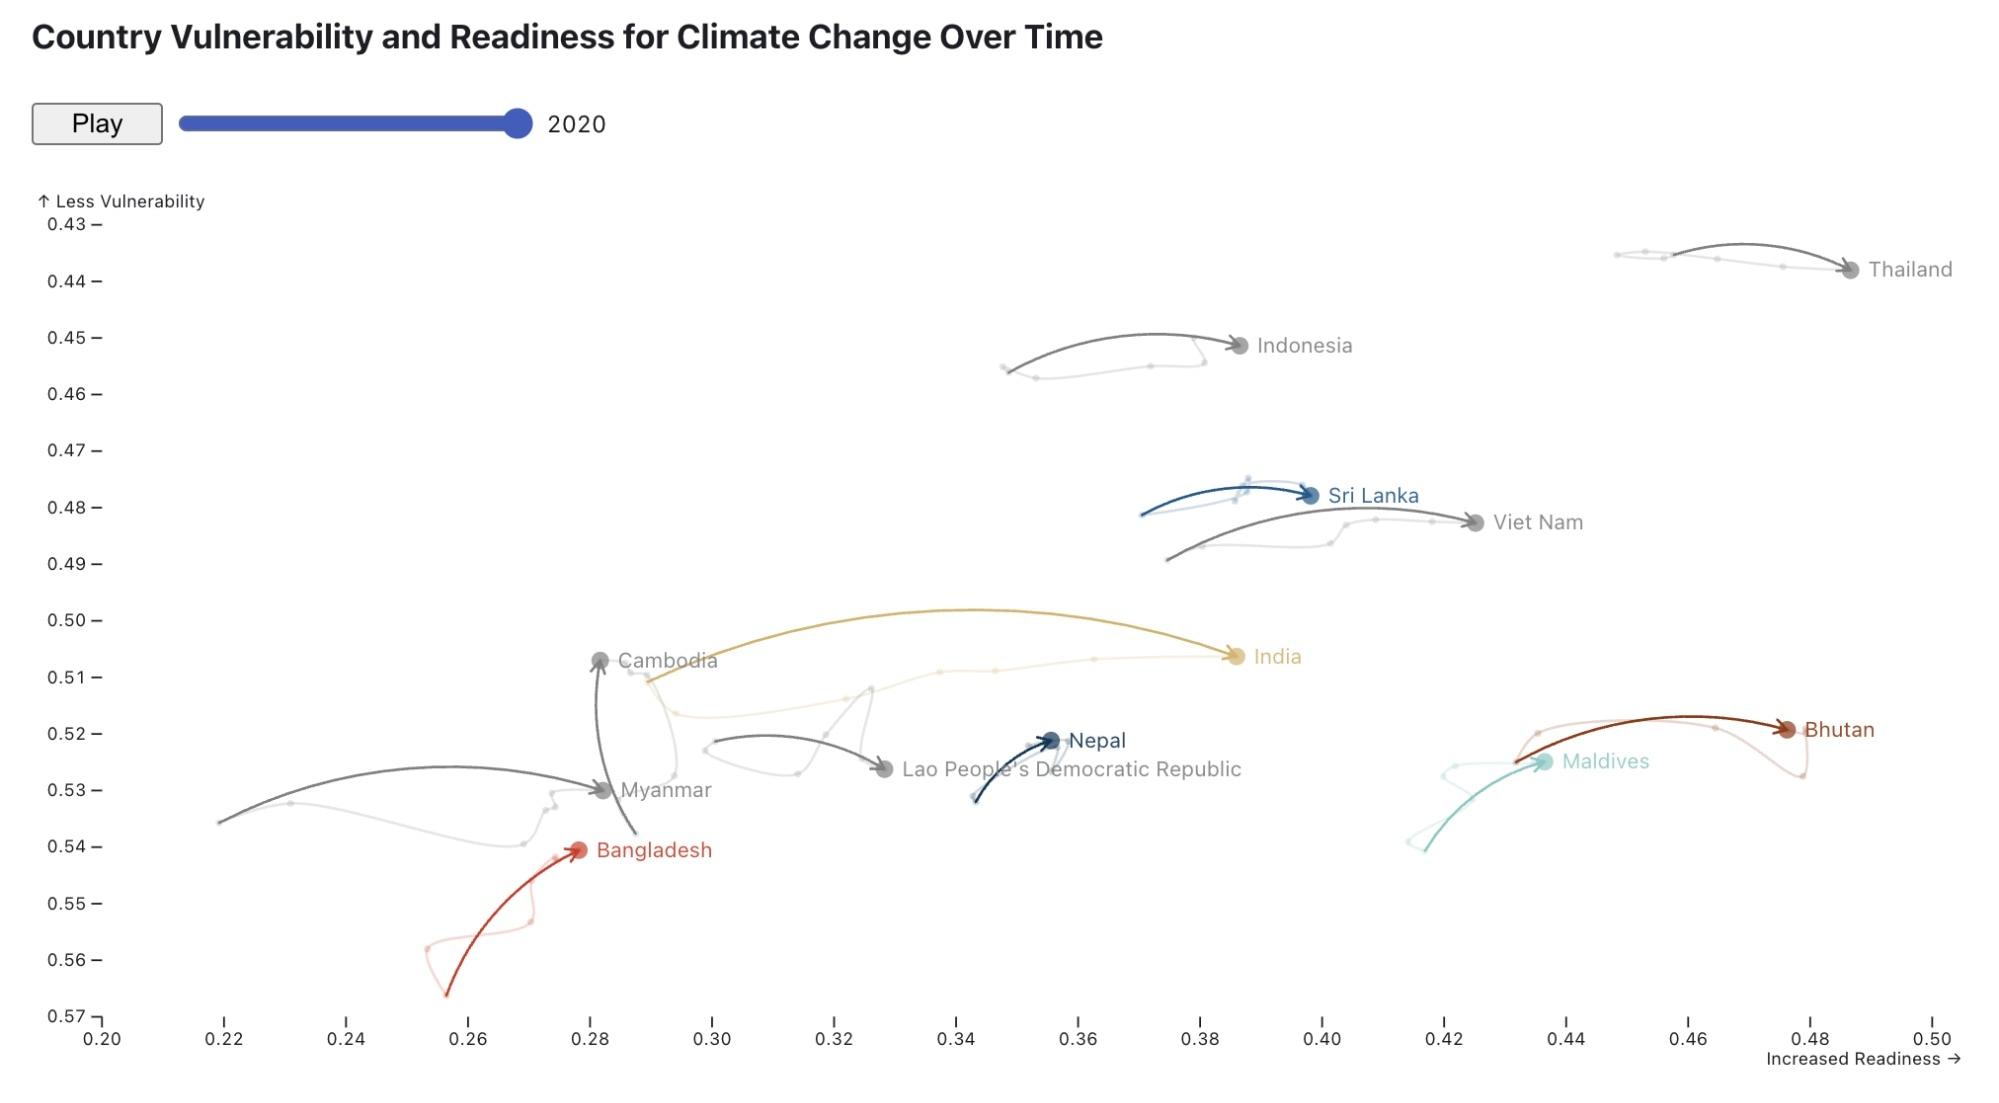
In late 2022, Periscopic learned that The Asian Development Bank (another Observable customer) was hosting a Visualizing Climate Change and Resilience Challenge and they decided to enter as a team. They were a finalist among the entries and their impressive submission focused on exploring how people are affected by and prepared for various natural disasters in the Southeast region of Asia.
Their entire team was able to work together, in Observable, to come up with a concept, explore the data, build impressive charts and ensure design cohesiveness in a fraction of the time previously required for a project of this scale. Their work demonstrates climate vulnerabilities and paths towards resilience and illustrates how people in that region are taking steps to mitigate it and adapt.
Submissions to the challenge gave an inspiring view into how diverse datasets, visualizations, and storytelling styles can be combined to create impactful and approachable narratives surrounding climate change. The different approaches that the entrants took highlight many paths that researchers can creatively and effectively use to communicate climate-focused insights much more easily using Observable.