Observable Templates

1.
Fork a template to get started
2.
Upload your data
3.
Edit any part to customize
Boilerplates
Notebook thumbnail
Get started with default styles for headers and images.
Notebook thumbnail
A good starting point for many two-dimensional charts with x and y axes.
Notebook thumbnail
A static U.S. map with county and state outlines.
Notebook thumbnail
A static world map with landmasses filled in.
Notebook thumbnail
Connect an HTML Canvas to a slider.
Notebook thumbnail
Connect an SVG graphic to a slider.
Notebook thumbnail
Visualize a correlation from a CSV dataset using Plot.
Notebook thumbnail
Visualize a quantitative distribution from a CSV dataset using Plot.
Notebook thumbnail
Get started with creative coding.
Notebook thumbnail
Get started with the lightweight 3D library built atop WebGL.
Notebook thumbnail
The simplest starting point for working with D3.
Notebook thumbnail
Get started with HTML Canvas.
Notebook thumbnail
Get started with SVG.
Notebook thumbnail
Get started with the popular 3D library, built atop WebGL.
Notebook thumbnail
Get started with high-performance fragment shaders connected to a slider.
Integrations
Notebook thumbnail
Manage virtual machines with the Amazon EC2 API
Notebook thumbnail
Access files with the Amazon S3 API.
Notebook thumbnail
Load information about a Figma document and fetch image assets.
Notebook thumbnail
Load a repository’s issues into a table.
Notebook thumbnail
Load a Google Sheet into a notebook and start visualizing it with Plot.
Notebook thumbnail
Upload a .db file to begin querying your database with this ubiquitous zero-configuration engine.
Notebook thumbnail
Load recent transactions into a notebook and start visualizing them with Plot.
Curated Datasets
Notebook thumbnail
Use this fake dataset to practice data exploration. Pizza Paradise was generated by the Observable team. Explore a variety of data visualization forms. Visualize pizza orders by day of week, see product trends over time, map revenue by location. Plot, facet, map, and more.
Developer Workflows
Notebook thumbnail
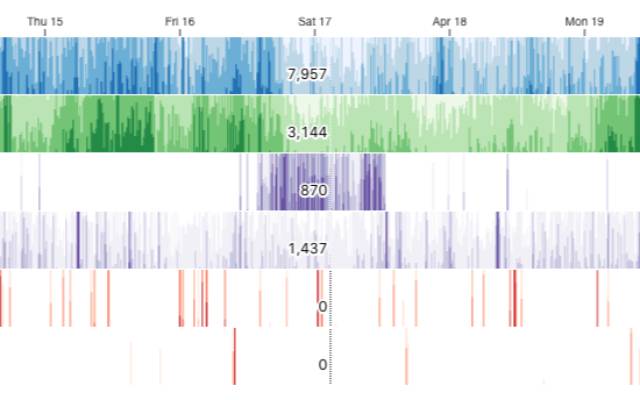
Monitor the status of your HTTP services with a condensed view of Amazon Web Services CloudWatch Logs.
Notebook thumbnail
Choose a user and repo and see live results for a curated subset of methods spanning the capabilities of the GitHub API.
Notebook thumbnail
When did a repo get its stars? Who was first, who was 100th? Chart it over time, annotated with tagged releases.
Notebook thumbnail
Use visualization to help select an appropriate reviewer for your pull request.
Notebook thumbnail
Help developers and managers ship pull requests faster by visualizing their activity timelines.
Notebook thumbnail
How long are your GitHub Actions integration tests taking to run?
Notebook thumbnail
Flaky tests waste engineer time; which GitHub Actions jobs fail and then pass when re-run?
Business Planning
Notebook thumbnail
See how payroll depends on the pace of hiring by placing prospective employees on a timeline.
Notebook thumbnail
The only expense is payroll, the key metric is growth, and most cash is VC; how long until you run out of money?
Notebook thumbnail
Compare a forecast, goal, or estimate to reality by filling up hollow bars.
Product Insights
Notebook thumbnail
What percentage of a sign-up cohort are still using your product after some weeks?
Notebook thumbnail
Do users who searched for you stay engaged longer than those who saw an ad? Compare retention across groups.
User Research
Notebook thumbnail
Correlate answers to pairs of questions; drill down to individuals who said this on one and that on the other.
Notebook thumbnail
Automatically suggests an appropriate visualization based on the properties of your Google Surveys or Qualtrics data.
Remote Work
Notebook thumbnail
Globally synchronized karaoke to combat the compounding lag of video chat singalongs.
Notebook thumbnail
Everything running over? Never getting to your crucial final agenda item? Put in a meeting start time and we’ll hold you to it.
Notebook thumbnail
Everything running over? Never getting to your crucial final agenda item? Click “Start“ when the meeting starts.
Notebook thumbnail
Randomly sort a group of people into smaller groups of roughly equal size.
Notebook thumbnail
Equitable speaking order for daily standups.