Holger Stitz
Working as Lead researcher @datavisyn on information visualization in life sciences. Lecturer. Web Developer.
Public collections
Showing all 6 collections
This tutorial develops your first D3 bar chart with animated transitions and filters step by step.
The original was created by Samuel Gratzl and is available at github.com/sgratzl/d3tutorial. It has been adapted and extended for Observable.

This tutorial implements a D3 pie chart and combines then with other visualizations into a dashboard.
The original was created by Samuel Gratzl and is available at github.com/sgratzl/d3tutorial. It has been adapted and extended for Observable.

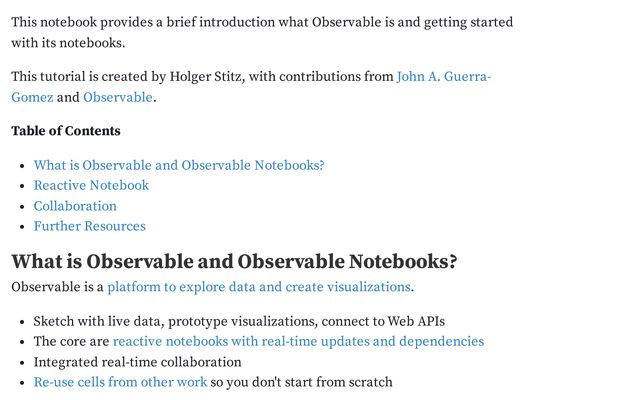
Introduction to Observable Notebooks and Observable Plot
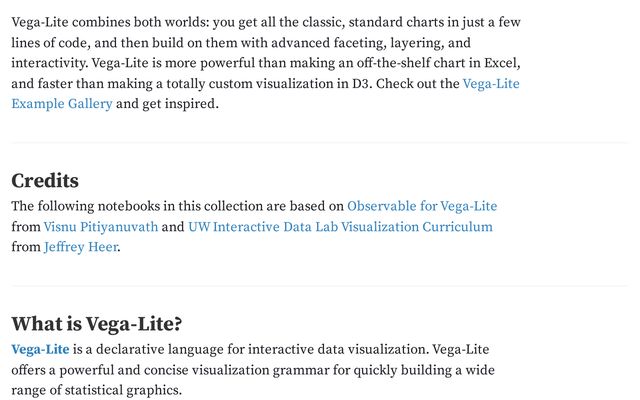
This tutorial explains how to create interactive charts with Vega-Lite. The notebooks are forked from Observable and UW Interactive Data Lab.
This tutorial explains the main concepts of D3 and how to build an Observable dashboard.