Data analysts need to explore and answer questions using big company data, often with short turnaround times to deliver on manager or stakeholder requests. But when data tools get overwhelmed by large datasets, analysis can be interrupted by spinning wheels, delayed interactions, and painstakingly slow charts and tables that discourage experimentation.
At Observable, we aim to make your data work feel fast and fluid, no matter the size of your data. We also want to keep data visible throughout analysis so that you can track changes and patterns in your data every step of the way. That’s why every node in Observable Canvases provides a window into your data, quickly displaying large underlying datasets as interactive tables, concise summary charts, or larger visualizations. Canvases also encourage branched, collaborative exploration that can result in a great number of interlinked nodes on the screen at any moment.
This poses a challenge, because those two goals — great performance, and pervasive data visualizations — are somewhat at odds with each other: the more data you try to show in the browser, the more you’re going to bog it down.
One way we’re able to maintain both speed and data visibility in canvases is by virtualizing tables. But what is table virtualization, and how does it improve app performance? Read on to learn the basics of table virtualization, how it impacts canvas speed and user experience, and some unique challenges we overcame during implementation.
What is table virtualization?
When exploring data, you probably don’t want to view it all at once. For example, viewing all 80 columns and 6M rows of a table at the same time is (1) practically impossible, and (2) makes things slow and unmanageable. That’s why most tools, including Observable Canvases, encourage viewers to view a smaller subsection of a table, then allow a user to scroll or expand to see more. For example, canvases show the first six columns and eight rows by default:
The question then becomes: if you’re only ever seeing a very small subset of rows and columns at any given time, does the browser really need to render all columns and rows in a table?
Spoiler alert: No, it doesn’t.
Enter table virtualization.
Table virtualization is a “what you see is what the page gets” approach to reducing how much content gets rendered on a web page at any time. It’s useful because rendering a large number of DOM elements can overwhelm the browser, making pages sluggish and frustrating to use.
What’s the DOM?
DOM stands for Document Object Model. The DOM is how your browser represents a web page’s HTML source code so it can render elements like paragraphs, images, and table rows or columns on the page.
By virtualizing tables, you limit what gets added to a page at any time by only rendering rows and columns that are currently visible to a user. As a user scrolls to a different section of the table, the previously rendered DOM elements that have been pushed outside the visible area are recycled, and repurposed in new positions to represent the table cells now in view.
In some cases, buffer columns and rows just beyond the visible area are also pre-rendered to ensure a smooth experience when a user scrolls through or expands a table. Since columns and rows around the edges are already waiting in the wings, they appear instantly. If that wasn’t the case, a viewer could see those elements being rendered on the page as they scrolled into view.
Here is a representative illustration comparing virtualized and unvirtualized tables:

How does table virtualization impact canvas performance?
Table virtualization drastically improves canvas performance and user experience. In canvases, we want users to pursue nonlinear, branched data explorations with rich tables and data visualizations displayed throughout. Canvases also support multiplayer editing, which means even more content is added as collaborators follow new analysis paths.

Observable Canvases encourage branching data exploration and the pursuit of new analysis paths, which means they often end up with a dense network of interconnected nodes.
The ease with which users can add new charts and tables, combined with our bias toward data visibility (for example, by automatically showing a table preview with summary charts for each operation), means that a huge amount of data can underlie what’s visible on the canvas at any moment.
Without virtualization, all of those out-of-view columns, rows, and summary chart SVGs are rendered unnecessarily. This quickly overwhelms the browser, severely degrading canvas speed and usability.
Michael Cooper, Observable Software Engineer, describes why table virtualization is a game changer:
Even when you just have a handful of nodes on the screen, each with something like a thousand cells, that adds up very quickly in terms of browser workload. Without table virtualization, if you try to zoom in or pan around the canvas, it just crawls. And with more complex canvases, or when data has a large number of columns, it can crash the browser. Virtualization is the difference between the app feeling smooth, or feeling janky and awful.

Michael Cooper
Table virtualization isn’t just important when working with really big data. Even with smaller tables, it can make a difference. “The more data, the more important table virtualization is,” Michael explains. “But you start seeing benefits anytime you have more data in a node than you can physically see at once on the screen.”
What unique challenges came up when implementing table virtualization in canvases?
The collaborative, interactive nature of tables in canvases posed unique challenges when implementing table virtualization.
The first challenge relates to how we deal with different collaborators who are interacting with the same table, at the same time, from different devices. Those users may be independently scrolling through tables to explore different slices of the data. Michael explains how this complicates table virtualization:
Just because one user can only see some of the columns, doesn't mean that all other users see the exact same thing. So we had to make sure that virtualization is tied to each user’s specific instance of the canvas, and not the general multiplayer instance.
Michael Cooper
By applying table virtualization to each user’s canvas instance, we ensure that teammates and stakeholders can independently explore tables, while cutting down everyone’s browser workload.
A second challenge relates to keeping table contents in sync. We use query snapshots to store the complete data output from each query. Snapshots ensure that table elements don’t ever exist in a Frankenstein-esque state, where outputs of a previous and current query are temporarily intermixed as the updated values are rendered.
Previously, when we ran a query in a virtualized table, the invisible (unrendered) columns were ignored. But then, when a user scrolled right or left, summary charts atop table columns would run their SQL queries the moment before coming into view. That would lead to users seeing newer summary charts load and appear alongside the older ones from the last snapshot.
To avoid this, we needed to ensure that all columns — not just the currently visible ones — were updated to use the new query snapshot. Michael summarizes: “We had to level up our querying game to understand that sometimes you still need to run queries, even for the things you can't see.”
Dive into canvases with the Observable team
Table virtualization is one way we’re making canvases a fast, fluid tool for data analysis and visualization. By only rendering visible columns and rows, we reduce how much of your browser’s brainpower is spent rendering unseen elements, so more is leftover to support smooth user navigation and interactions.
Learn how Observable streamlines data analysis, gets you from raw data to state-of-the-art interactive data visualizations in minutes, and brings data teams and stakeholders together to align on business decisions. Request a demo today.
Post script
In an early draft of this post, I had written that “viewing all 80 columns and 6M rows of a table at the same time is impossible.” I was corrected by Michael, who commented: “Fun fact: if you had a monitor that was 27 kilometers tall you could show all those rows.” 😆
Here is the record of his calculation, which assumes 135 DPI and a ~24 px minimum row height:
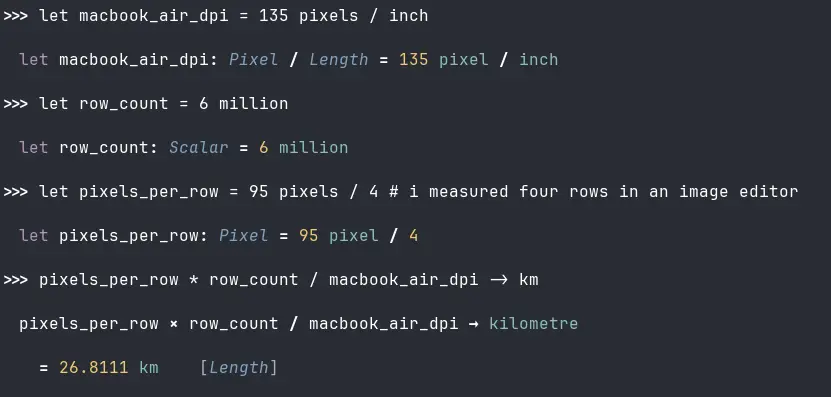
It now reads “practically impossible.”