UNAVCO is a non-profit organization, supported primarily by the National Science Foundation, with a mission to understand the Earth and how it changes over time; from its atmosphere, to its crust, and all the way down to its center. They tackle this audacious goal by deploying sensors across the planet to directly measure the Earth over time with sub-millimeter accuracy, through the scientific practice of geodesy.
They were the first to directly measure plate tectonics in 1996, and continue to use their sensor networks to forecast earthquakes, measure stormwater, study the impact of climate change, or even use signals traveling between the sensors and satellites to do a CAT-scan-like analysis of the sky.
As a testament to the massive scale and impact of their undertaking, Popular Science proclaimed them the most epic science project in a July 2011 article, ranking them above the Space Station and the Large Hadron Collider.
The challenge of making data accessible
“We are close to generating a petabyte of geospatial data a year and the discovery of all this data is complicated,” says David Mencin, Director of Data Services at UNAVCO.
UNAVCO’s network of sensors has been capturing data for over 30 years, but this enormous treasure of data can only reach its full potential when it is easily discoverable and accessible by their team and the broader scientific community. While well-defined APIs are essential to enable access, too often documentation can be unclear making the API difficult to use.
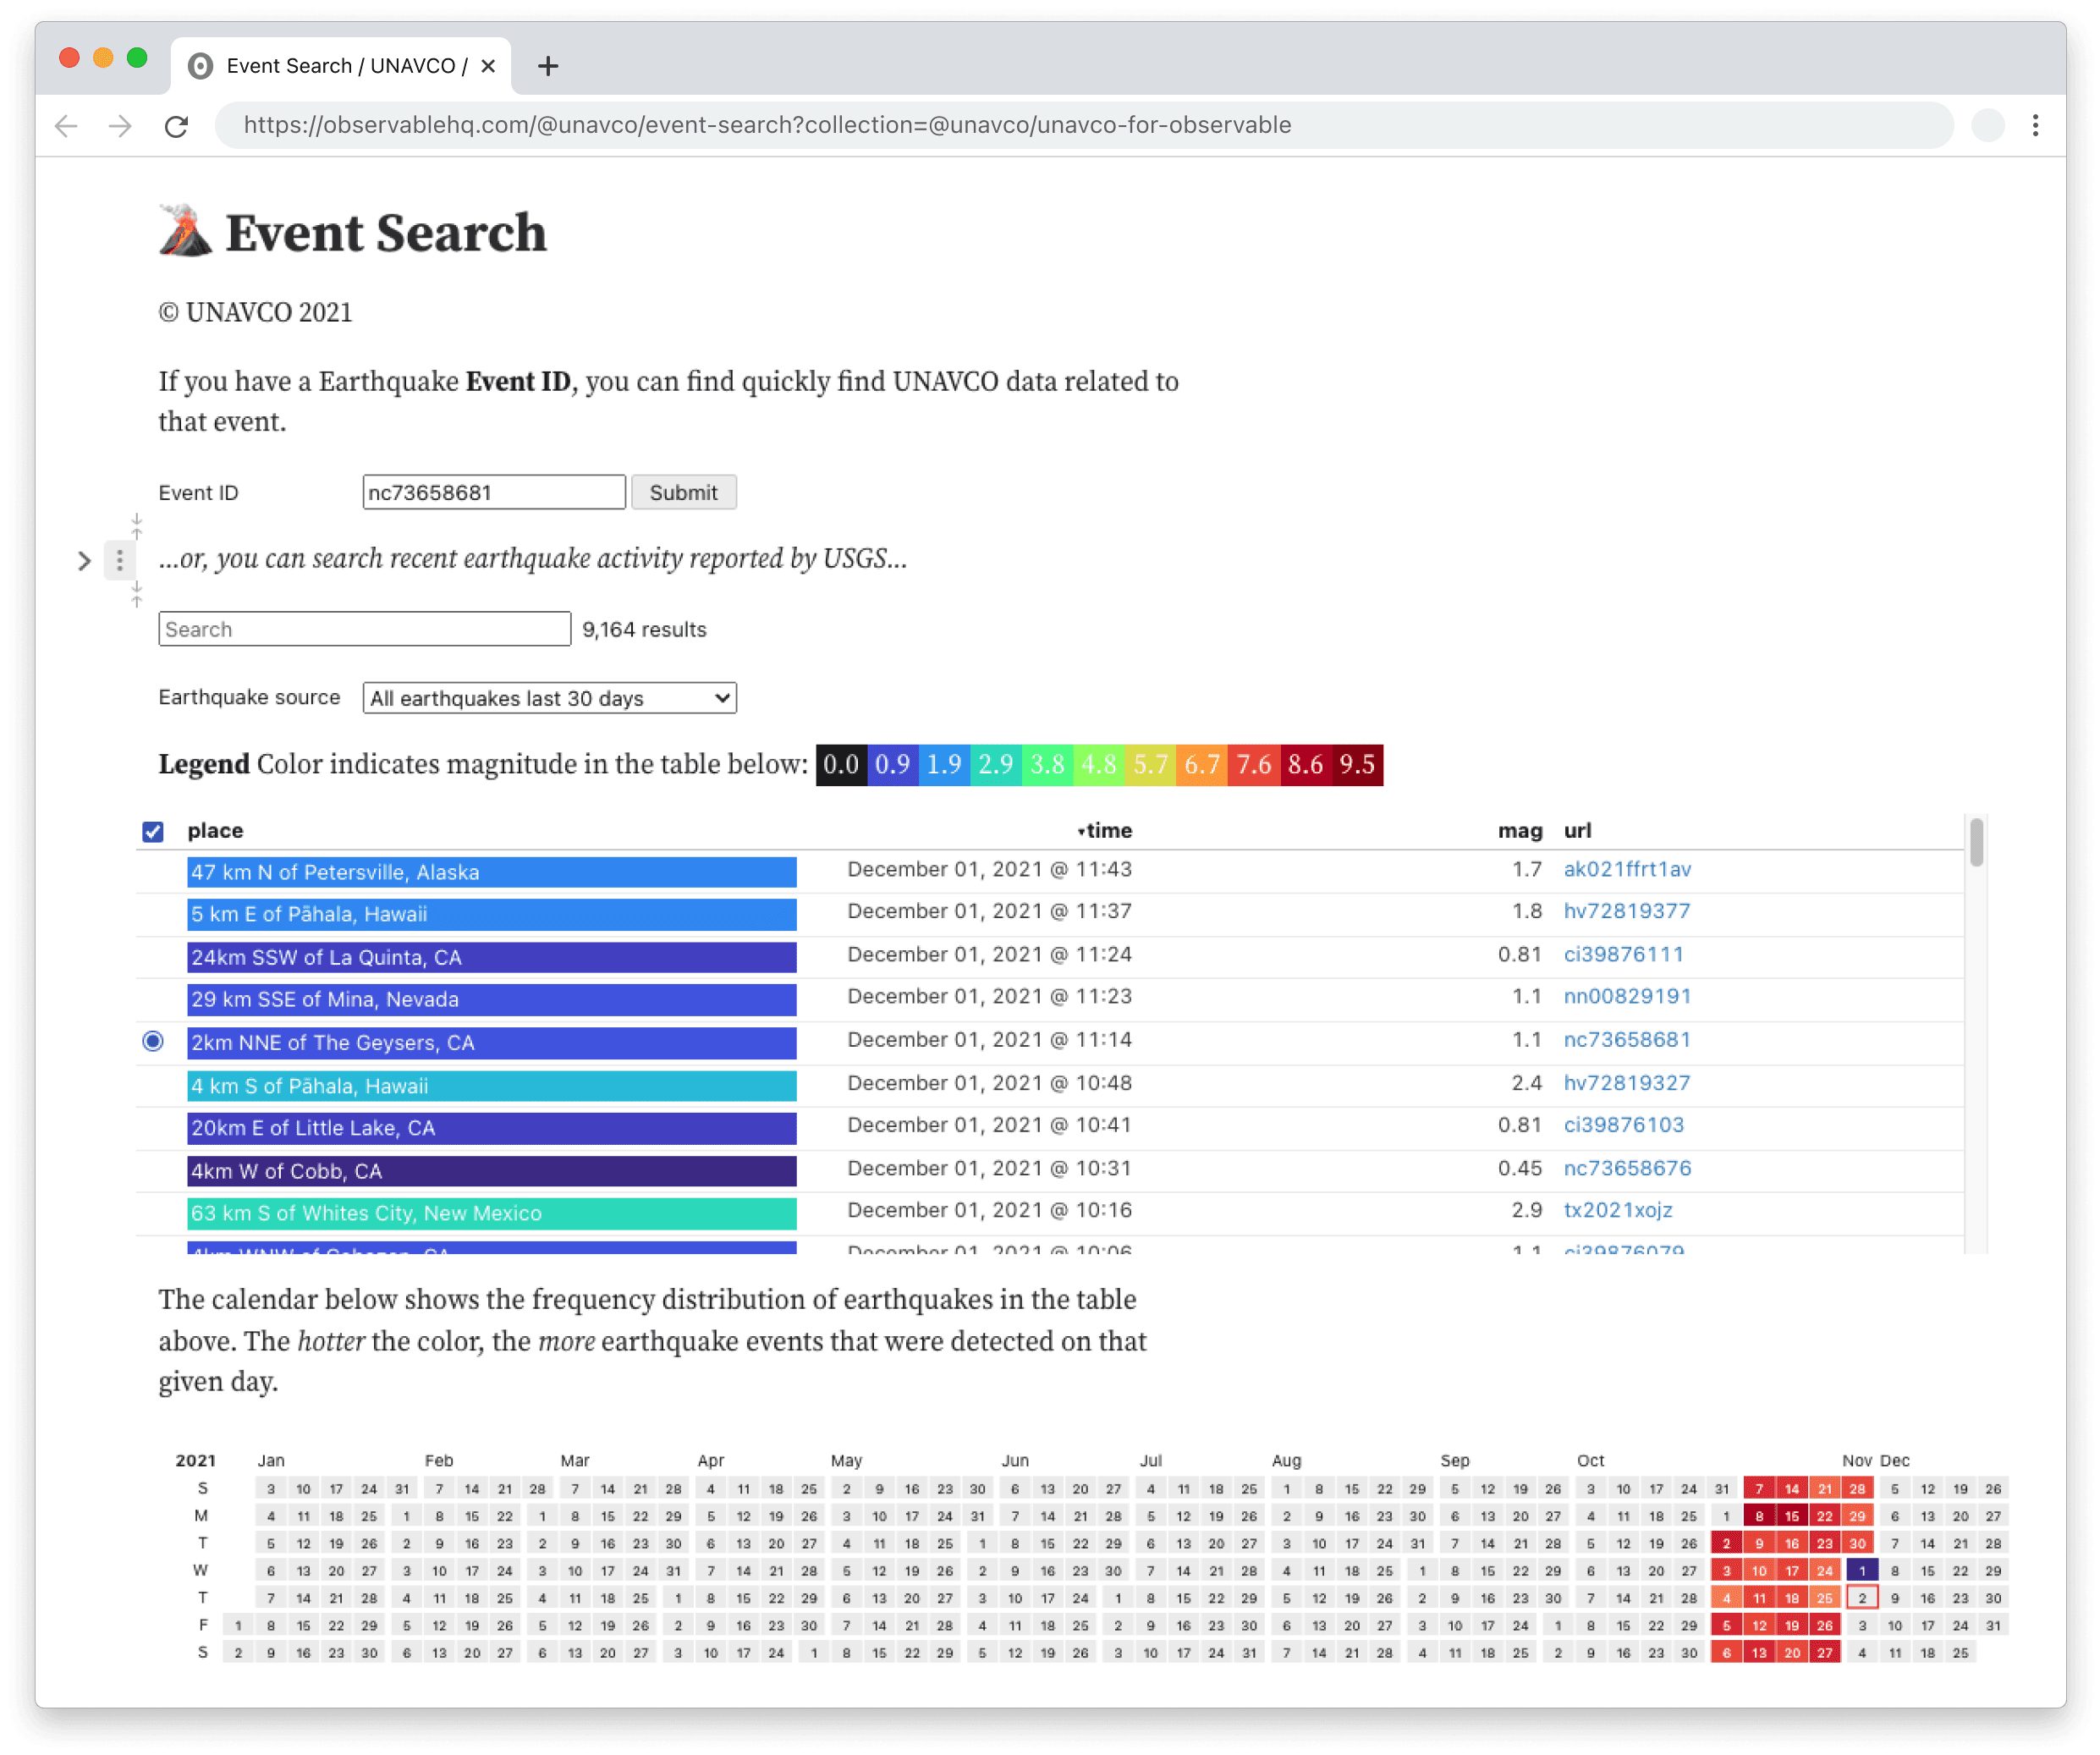
“Explaining APIs through documentation is not enough. If I can’t make a live demo of the API, then I haven’t really proven that it works and is something easy enough for people to use,” explains Brooks Mershon, a software engineer spearheading the development of modern in-browser data exploration tools at UNAVCO.
Enabling data discovery and exploration
With Observable, Brooks and his team build live demos of UNAVCO’s data APIs, visual tools to query data, and exploratory dashboards for analysis in notebooks that are easy to share and readily accessible. These notebooks empower the broader scientific community to discover data and build custom visualizations using UNAVCO’s examples as a starting point.
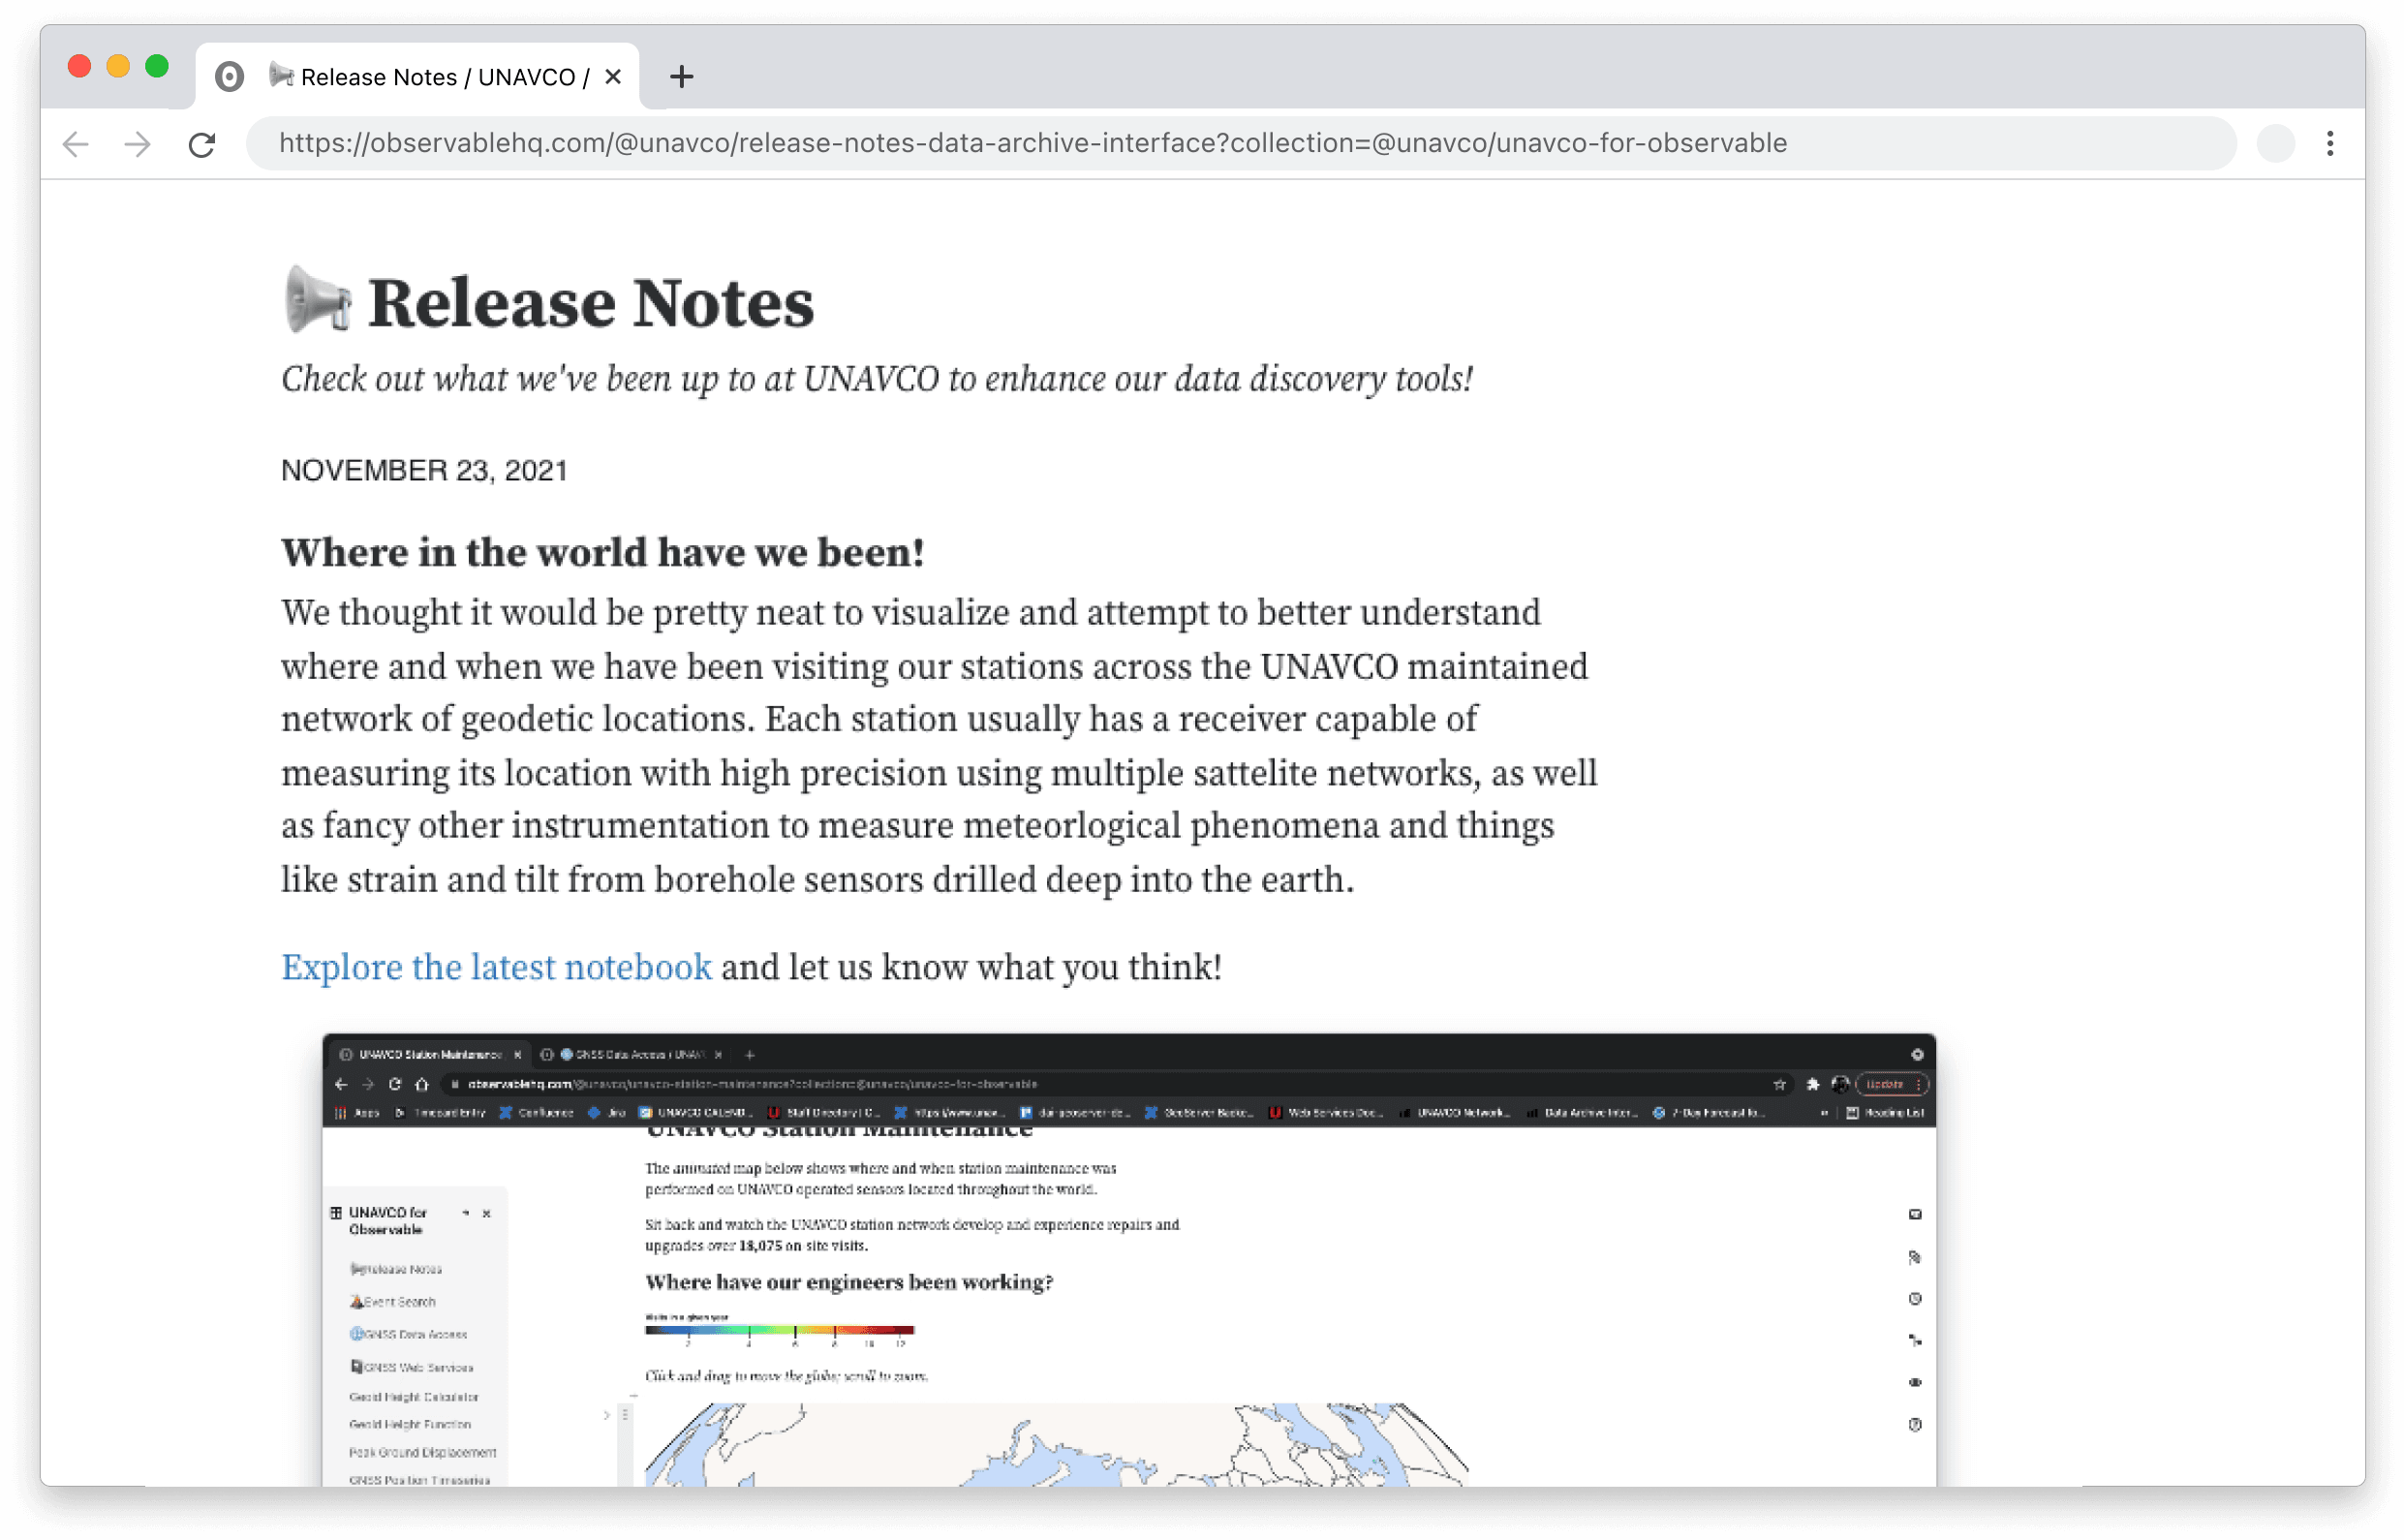
UNAVCO’s interactive tools are engaging and encourage their users to explore their data. An example is this notebook that visualizes sensor maintenance over the past 30 years, and allows users to dig deeper using tables and inline charts to explore curiosities like locations of the most frequented sites. The animated globe from this notebook, shown here through Observable’s standard embedding tool, shows spatial trends of network maintenance over time.
Rapid prototyping and development
When Brooks wants to test out an idea, he needs to be able to quickly build and share a prototype.
“Iteration is needed to converge at a good idea. Without Observable’s framework, I don’t think my design and feedback iteration loop would be fast enough to really work. Being able to say, ‘What do you think?’ and ‘Let’s try again’, fundamentally changes the game,” says Brooks.
Observable abstracts away the low-level details that distract from developing an idea, but it retains the flexibility to support UNAVCO’s unique data. “I can spend more time thinking about the actual data instead of figuring out how to make a drop-down menu,” explains Brooks.
Observable’s vast public repository of re-useable code components make it easy for Brooks and his team to incorporate UI elements, like tables or color legends, so that they can focus on exploring the data.
Sharing their stories with the world
Like many in the scientific community, UNAVCO relies on other tools for heavy computational work. However, when they need to share their work or explore their data in a way that allows everyone to participate, they choose Observable. It lets the community effortlessly build on each other’s work and allows UNAVCO to tell stories with their data so that more people around the world can be inspired by what they do.
“We are big users of Python and Jupyter notebooks, but when we need to share or embed in a webpage, we turn to Observable. Feedback from the community has been 100% positive,” says David.
UNAVCO uses Observable notebooks to tell stories with their data.