Notebooks
Resources
Pricing
Sign in
Get started
Trending
Recent
Most stars last month
Most stars all time
Recent
Showing
1-30
of
10,000
notebooks
Prev
Next
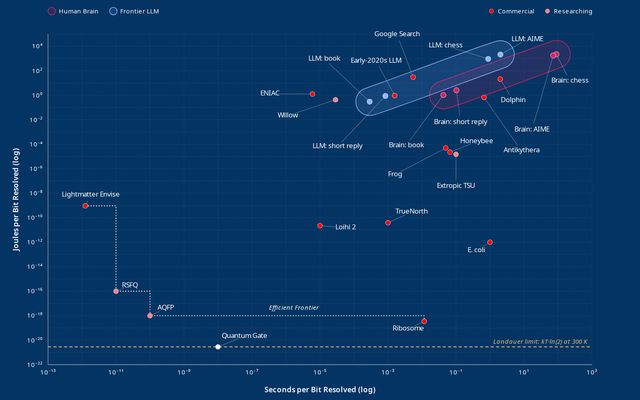
Efficient Frontier of Compute
North Branch Media
Aug 2
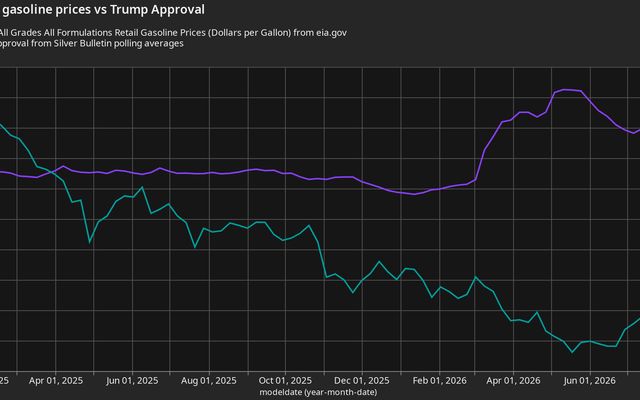
Retail Gasoline Prices vs. Trump Approval
John Haldeman
Aug 1
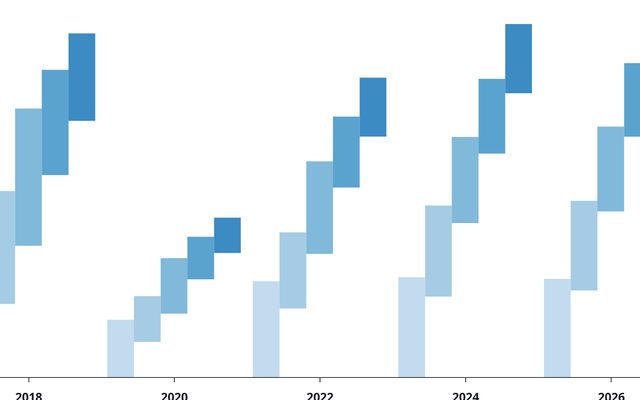
Stacked-to-grouped bars
This notebook is a fork
Lean Media GmbH
Aug 1
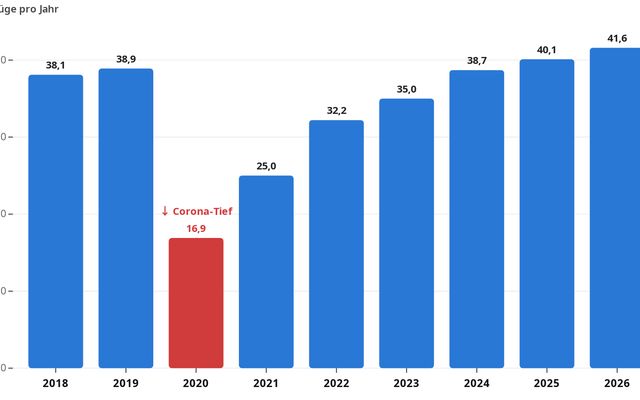
Flugverkehr Weltweit nach Jahren
This notebook is a fork
Lean Media GmbH
Aug 2
QH88 - Sân Chơi Cá Cược Chuẩn Châu Á Với Sảnh Game Thưởng Lớn
9Qh88 com
Aug 1
鹽博士煙油的品牌形象與市場策略分析
mcnetarpuf
Aug 1
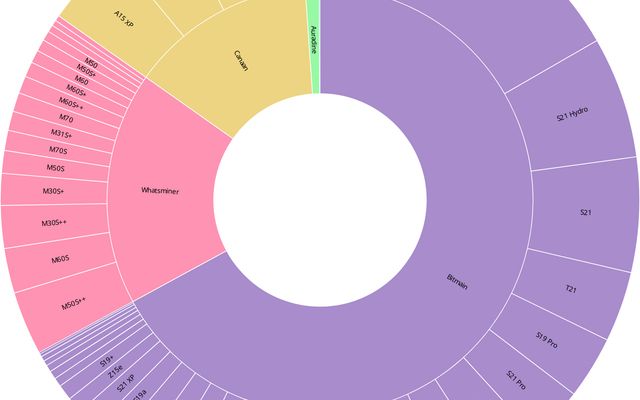
Zoomable sunburst
This notebook is a fork
Vitaliy Kruk
Aug 1
電子煙油自製需要注意的關鍵要素與技巧
mcnetarpuf
Aug 1
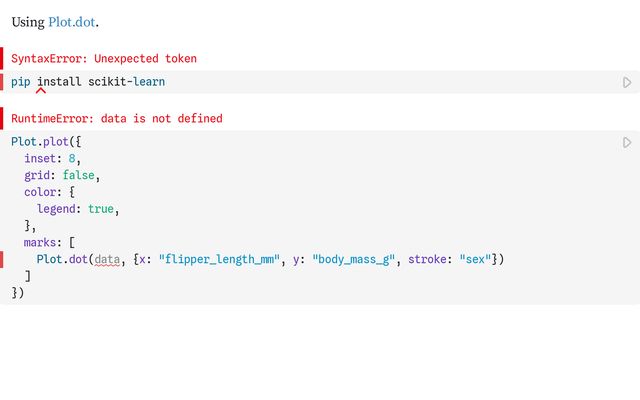
Plot Scatterplot
This notebook is a fork
AANANDITTT
Aug 1
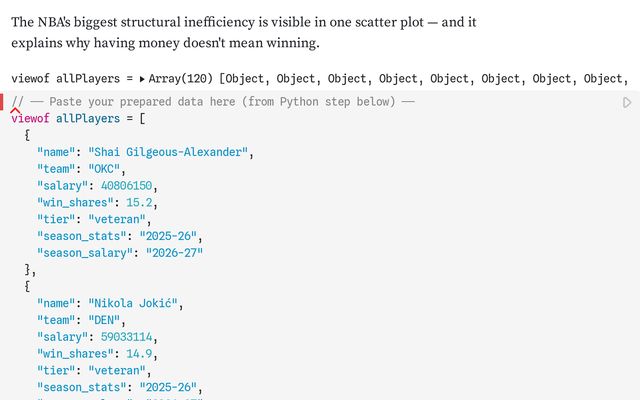
Rookie Goldmines & Veteran Anchors: NBA Salary vs. Wins Added
Etienne Pema Lafleur
Aug 1
Plot Scatterplot
This notebook is a fork
@M0ula__ab
Jul 31
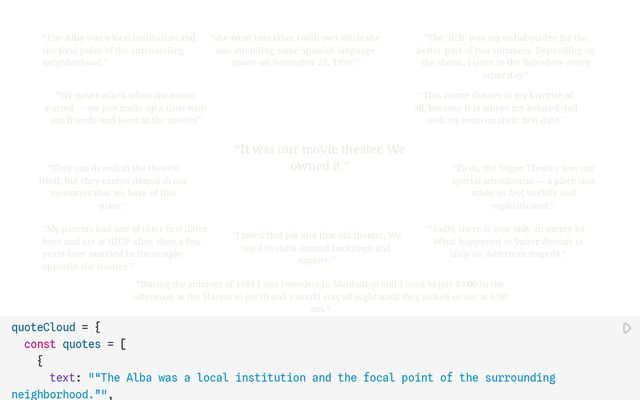
Cloud of words
by-ali
Jul 31
PEQ Heatmap using PhamClust
WabushOnce
Jul 31
Kids Note - The Pudding
Sneha karunanithi
Jul 31
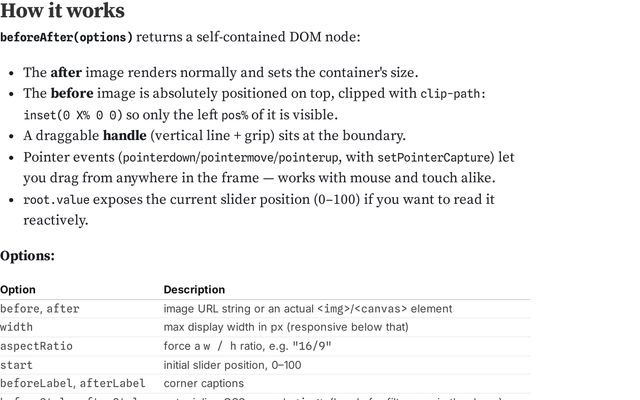
Before/After image comparison with slider
Mikal Hitsøy Henriksen
Jul 31
•
1
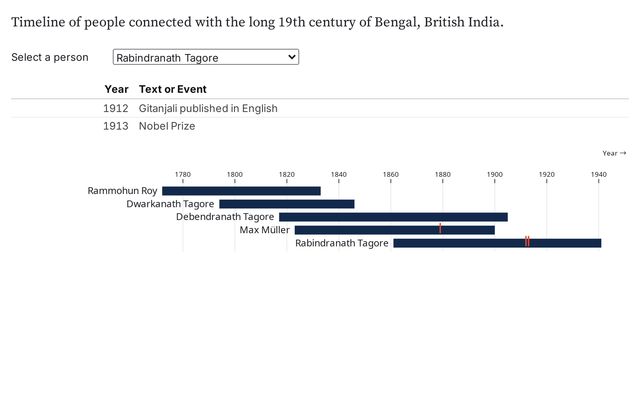
Persons Timeline: I
Rini B. Mehta
Jul 31
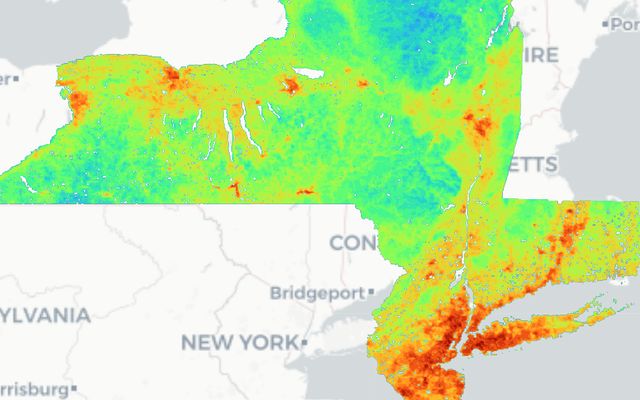
UTCI July 2022 - New York, New Jersey, Connecticut
This notebook is a fork
Gabriel Aldana
Jul 31
Binary Black Holes Remix
This notebook is a fork
Lao
Jul 31
•
2
5
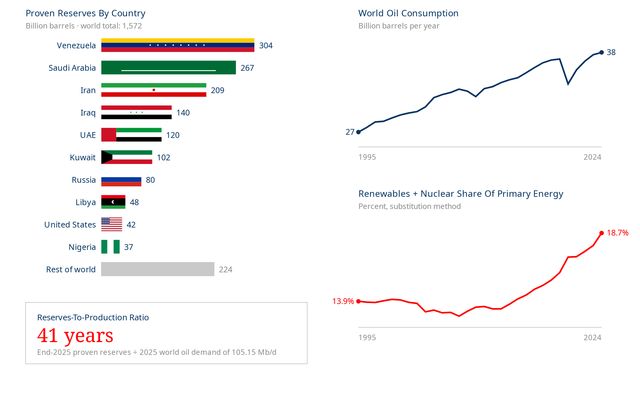
Proven Crude Oil Reserves and Energy Consumption
North Branch Media
Jul 31
Raft Motion Planning
David Kirkby
Jul 30
Calculating Settings
This notebook is a fork
Elias
Jul 30
Tick Markers - Issues with SVGs in Illustrator
Jim
Jul 30
Bridge Sentinel_Julia
Qian Xiang
Jul 30
Canada's Missing Trade Potential
This notebook is a fork
Mohamed Khalil Larhrib
Jul 30
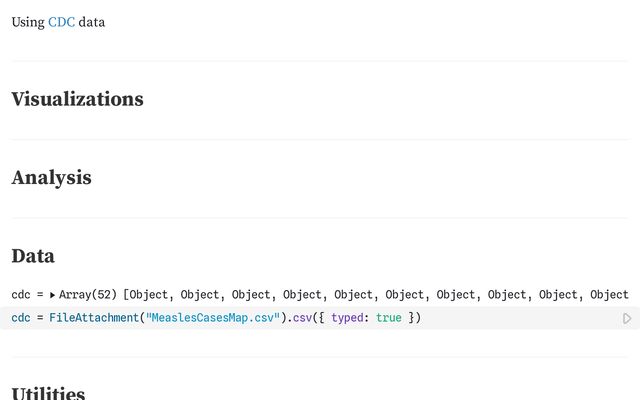
Measles cases in the US
This notebook is a fork
Andrew Witherspoon
Jul 30
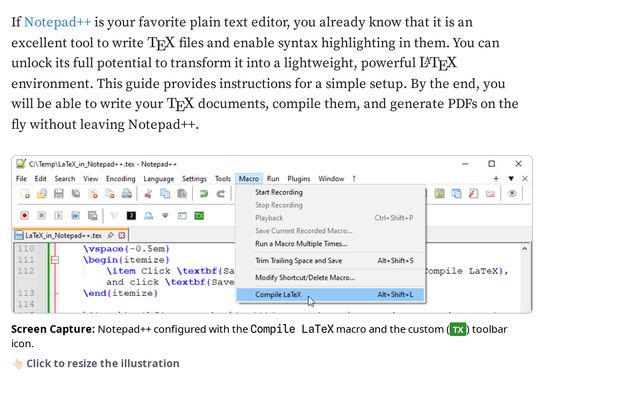
Using Notepad++ to Compile LaTeX
Christophe Yamahata
Jul 30
Blog Post
This notebook is a fork
ApplePlanet.pl
Jul 30
Heilpflanzen und ihre Wirkung
This notebook is a fork
Maja Trzeja
Jul 29
WNBA Pride Games:
elanareb
Jul 29
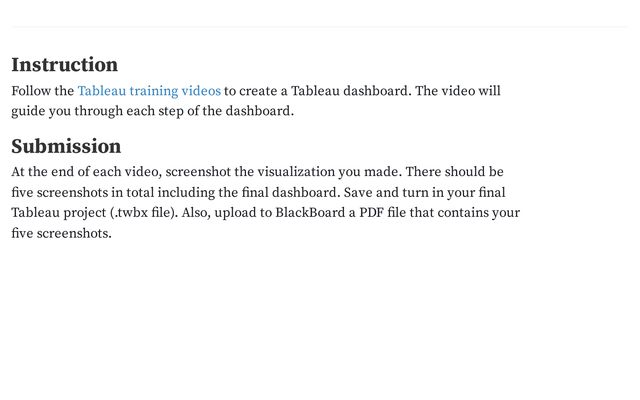
Extra Lab: Tableau
Haoyu Li
Jul 29
Showing
1-30
of
10,000
notebooks
Prev
Next