Platform
Resources
Pricing
Sign in
Get started
Trending
Recent
Most stars last month
Most stars all time
Recent
Showing
61-90
of
10,000
notebooks
Prev
Next
Learning Vis Tools Tutorial 8: Visualization with D3.js
This notebook is a fork
TroyFeng
Apr 9
Zoom to bounding box
This notebook is a fork
LOCKED
Apr 9
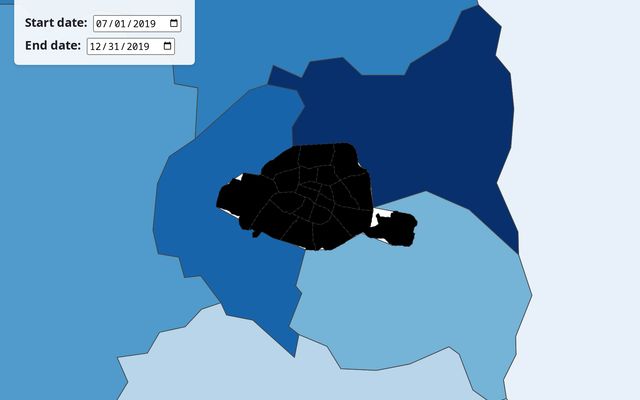
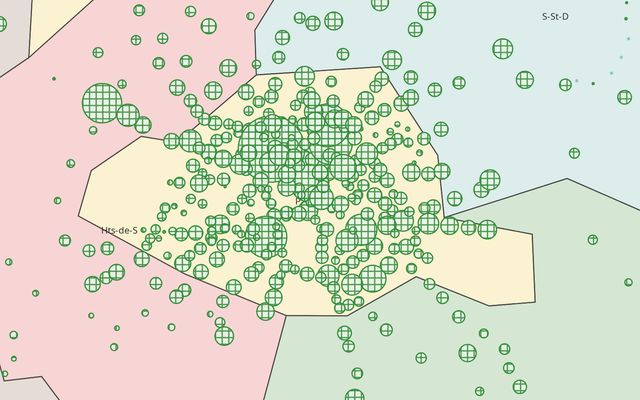
Anatomy of public transport in Paris
This notebook is a fork
Data visualization - Polytech
Apr 9
Walmart’s growth
This notebook is a fork
Waldek Węgrzyn
Apr 9
Learning Vis Tools Tutorial 8: Visualization with D3.js
This notebook is a fork
workspace
Apr 9
Introduction to data wrangling and analysis in JavaScript - Session 4 Follow-along…
Data Visualization
Apr 9
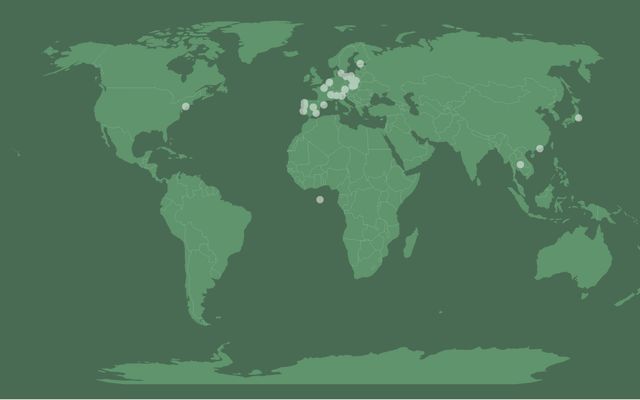
Plot World Map
This notebook is a fork
Peter's Workspace
Apr 9
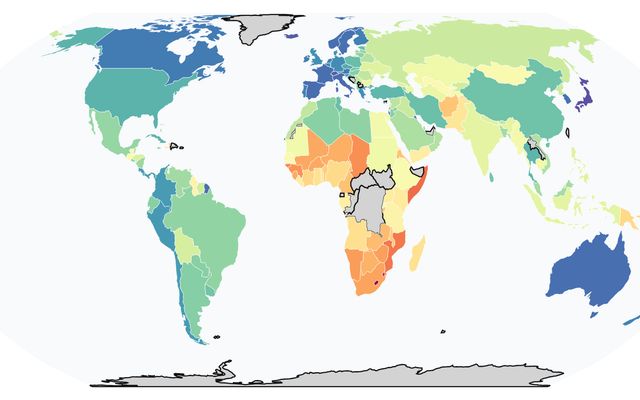
Plot World Map Cartogram
This notebook is a fork
Peter's Workspace
Apr 9
Introduction to data wrangling and analysis in JavaScript - Session 3 Follow-along…
Data Visualization
Apr 9
Introduction to data wrangling and analysis in JavaScript — Session 2 follow-along…
Data Visualization
Apr 9
Introduction to data wrangling and analysis in JavaScript — Session 1 Follow-along…
Data Visualization
Apr 9
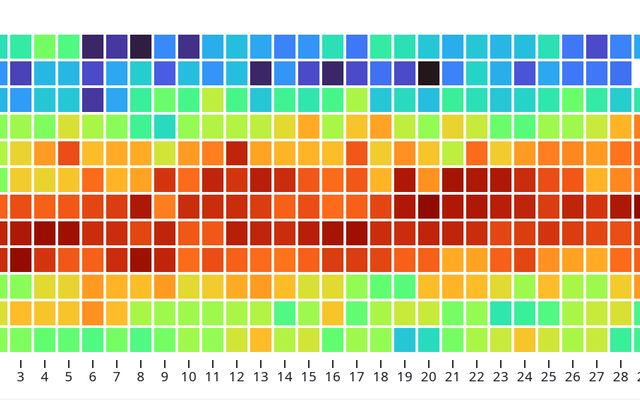
Spider Graphs of Decomposed Scores 2009-2025
This notebook is a fork
GWM 2026
Apr 9
Learning Vis Tools Tutorial 8: Visualization with D3.js
This notebook is a fork
SH not_cold
Apr 9
Adapting a D3 Visualization to New Data (CSE478)
This notebook is a fork
test
Apr 10
•
1
Anatomy of public transport in Paris
This notebook is a fork
Data visualization
Apr 9
Departements IDF: Zoom & Cluster
This notebook is a fork
Data visualization
Apr 9
Wikipedia Grey–green satellite/perspective projection maps generator
This notebook is a fork
Pilk
Apr 9
Duy Khang Pham_CSE478_Milestone 1
Duy Khang Pham
Apr 9
Fundamentos de D3 - 2026-1
VisualizacionDatosUtec
Apr 9
HW 3: Interactive Visualization
Ehomburg28
Apr 9
Test
robi santoso's Workspace
Apr 9
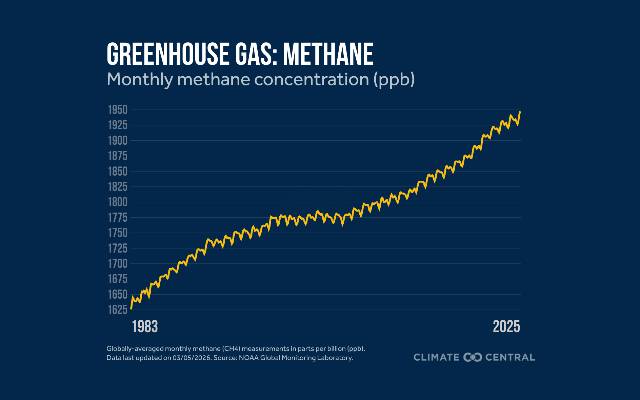
Greenhouse Gas: Methane
Climate Central
Apr 9
Choropleth Mapping [SEES 3540]
This notebook is a fork
uiowa
Apr 9
DSBA 5122 - ObservableHQ notebook
DSBA-5122-charts
Apr 10
Departements IDF
Data visualization
Apr 9
Session 1: Introduction to Observable Plot (Follow-along version)
This notebook is a fork
sunny
Apr 9
Session 1: Introduction to Observable Plot (Follow-along version)
This notebook is a fork
Mohammed Qurneh
Apr 9
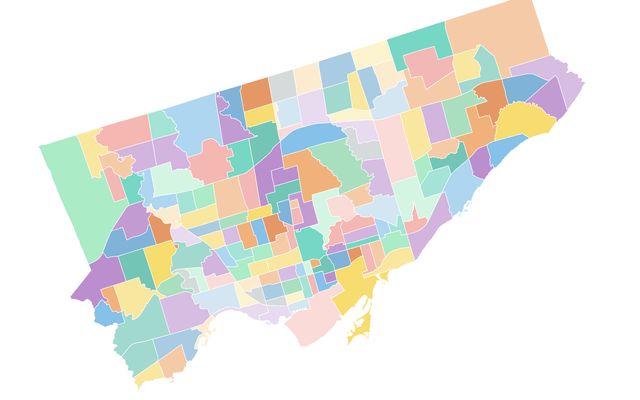
Interactive Neighbourhood Explorer
University
Apr 9
Total Worker Health: Visual Interactions
This notebook is a fork
JE
Apr 10
# Bivariate Choropleth Mapping
This notebook is a fork
GeoVis
Apr 8
Showing
61-90
of
10,000
notebooks
Prev
Next