Platform
Resources
Pricing
Sign in
Get started
Trending
Recent
Most stars last month
Most stars all time
Recent
Showing
211-240
of
10,000
notebooks
Prev
Next
Arc diagram
This notebook is a fork
reuben
Apr 6
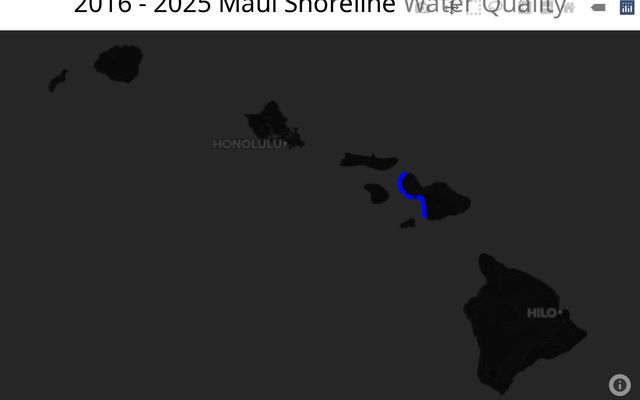
Maui Map
ICS 684
Apr 6
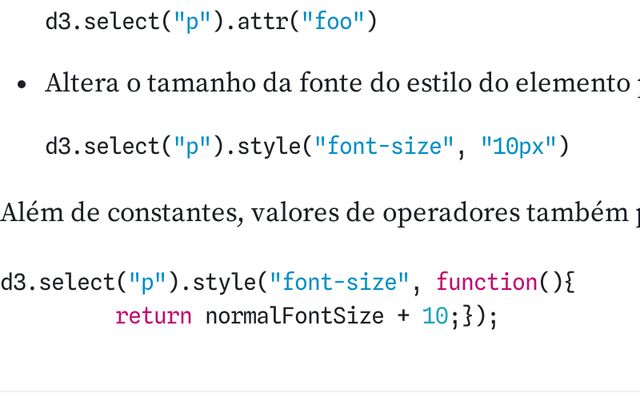
Introdução ao D3 com Observable (Parte 1)
This notebook is a fork
Jamires
Apr 6
Introdução ao D3 com Observable (Parte 1)
This notebook is a fork
Visualização
Apr 6
Introdução ao D3 com Observable (Parte 1)
This notebook is a fork
new workspace
Apr 6
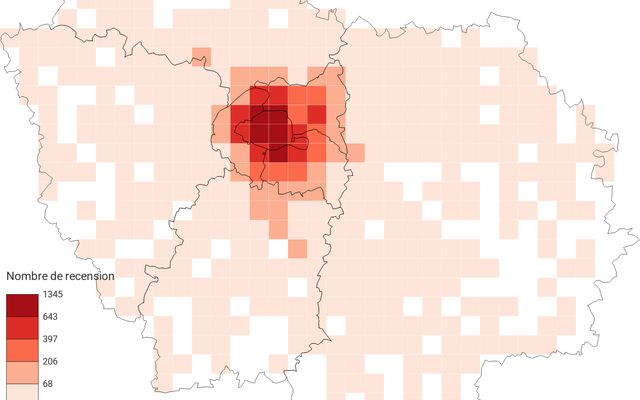
Visualisation d'accidents de voiture en Ile de France
personel
Apr 6
•
1
Introdução ao D3 com Observable (Parte 1)
This notebook is a fork
J Henrique
Apr 6
Introdução ao D3 com Observable (Parte 1)
This notebook is a fork
lfurtado
Apr 6
Introdução ao D3 com Observable (Parte 1)
This notebook is a fork
VisualizacaoDeDados
Apr 6
Introdução ao D3 com Observable (Parte 1)
This notebook is a fork
data-visualization
Apr 6
Introdução ao D3 com Observable (Parte 1)
This notebook is a fork
Observableweb
Apr 6
Adapting a D3 Visualization
ASU
Apr 7
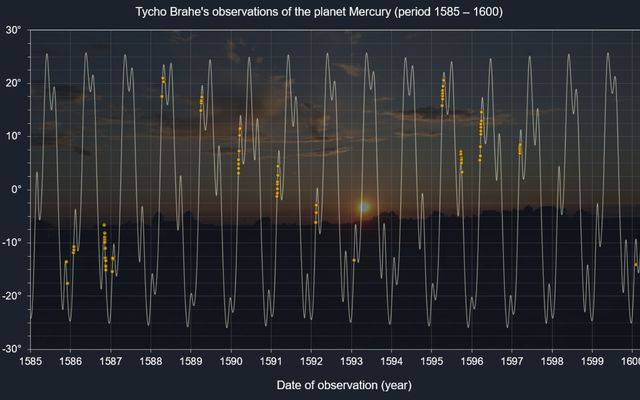
Visualizing Tycho Brahe's astronomical observations of Mercury
This notebook is a fork
Christophe Yamahata
Apr 6
Zoomable circle packing
This notebook is a fork
ASU
Apr 6
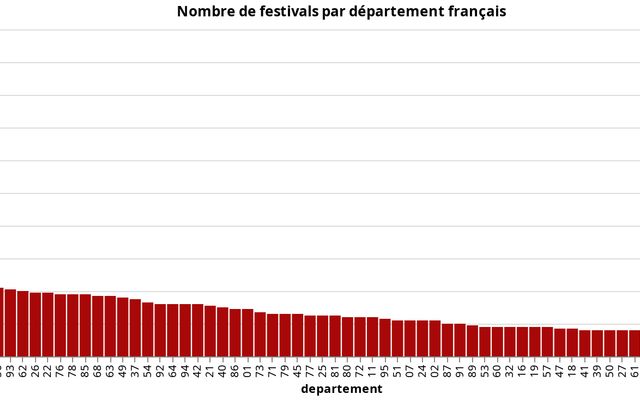
Visualisation des festivals en France
seb
Apr 6
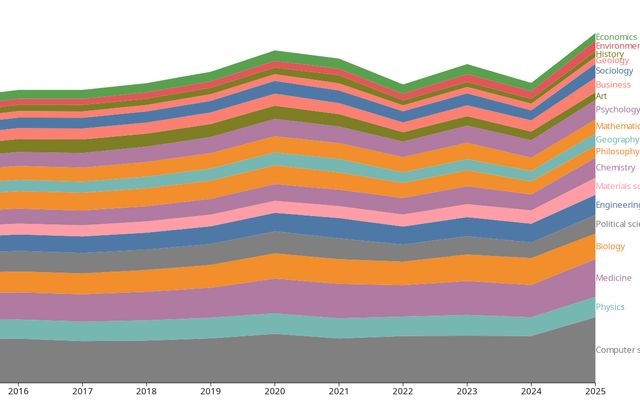
Open Alex Data Evolution
This notebook is a fork
Prototyperspective
Apr 7
•
1
1.5 TP-3: Introducción a Observable y D3
This notebook is a fork
Leo Serpa
Apr 6
Learning Vis Tools Tutorial 8: Visualization with D3.js
This notebook is a fork
Workspace
Apr 9
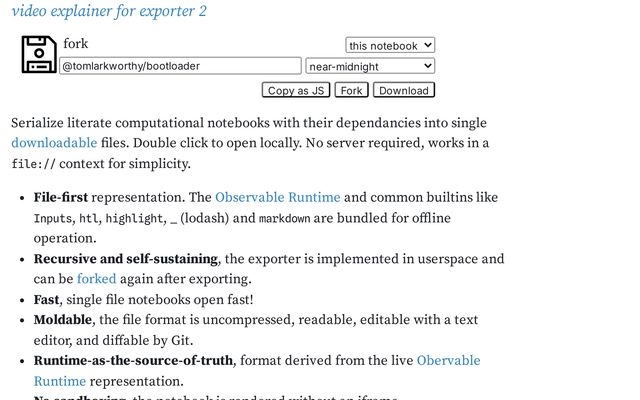
Exporter 3
Tom Larkworthy
Apr 6
•
1
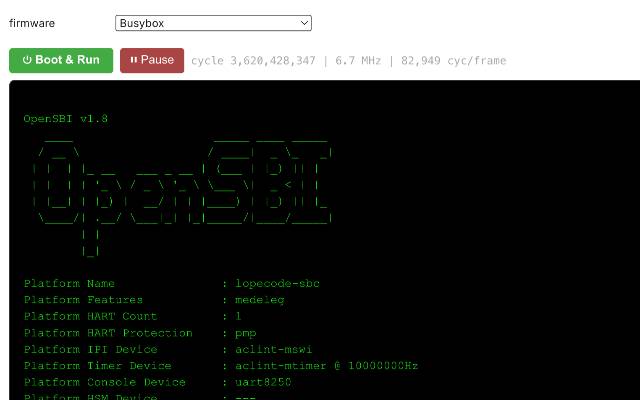
RISC-V Linux BusyBox Single Board Computer
Tom Larkworthy
Apr 6
•
4
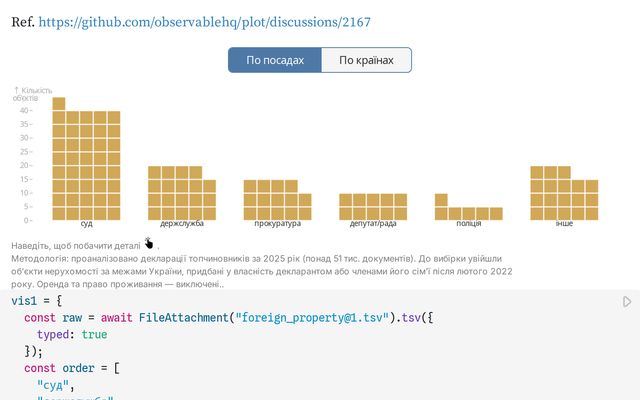
Plot.waffle with individual points
This notebook is a fork
mraleksa
Apr 6
Visualisation de feux de forêt en Corse
Geodata Paris
Apr 6
•
1
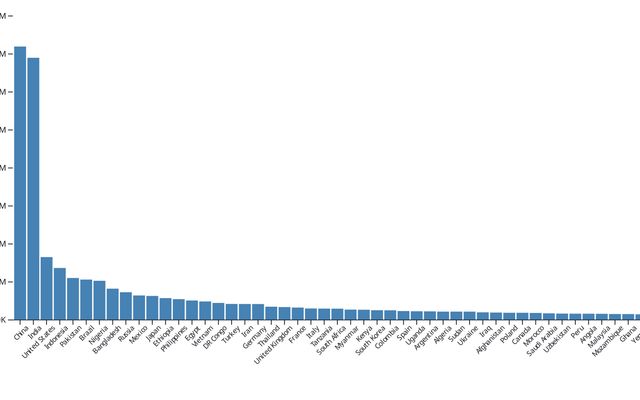
Starbucks Growth across the World -- CSE478 Assignment
This notebook is a fork
CSE478-2026
Apr 6
Question 2
Rubel
Apr 6
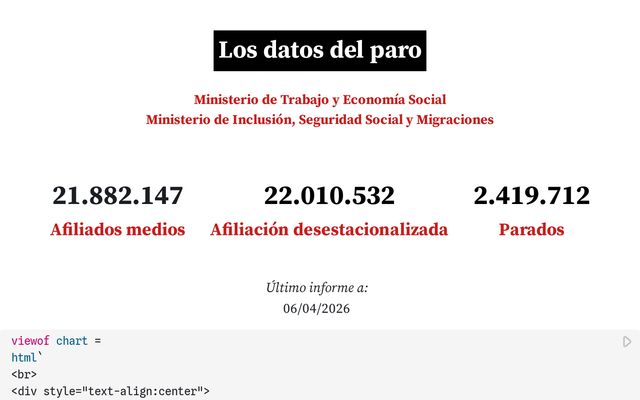
Los datos del paro
Newtral Data
Apr 6
Question#1
Rubel
Apr 6
Untitled## Section 1 — Original Visualization
Divyansh
Apr 6
Adapting a D3 Visualization to New Data
krishnasowrkspace
Apr 6
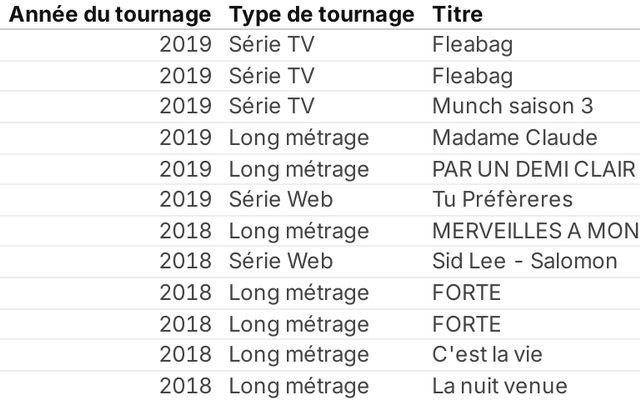
Visualisation des lieux de tournage à Paris
personal
Apr 6
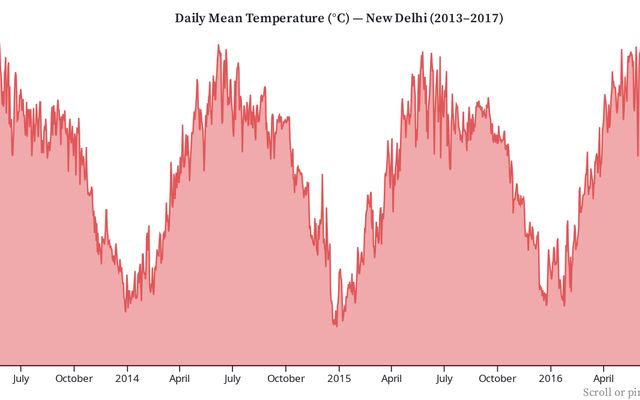
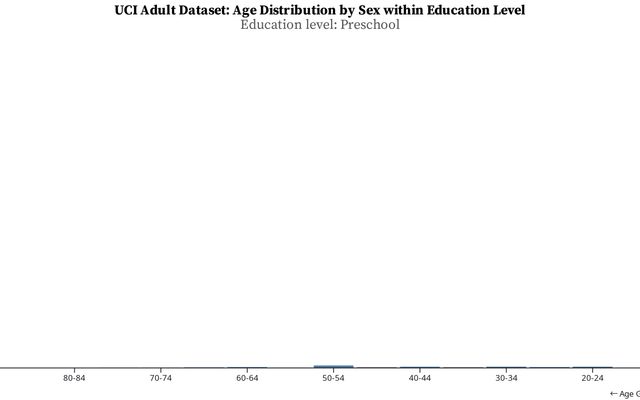
Adapting an Animated Population-by-Age D3 Visualization to the UCI Adult Dataset
ASU
Apr 6
Showing
211-240
of
10,000
notebooks
Prev
Next