Platform
Resources
Pricing
Sign in
Get started
Trending
Recent
Most stars last month
Most stars all time
Recent
Showing
241-270
of
10,000
notebooks
Prev
Next
Assignment 2 by S M Mazharul Hoque Chowdhury (Part 2)
University of North Texas
Apr 6
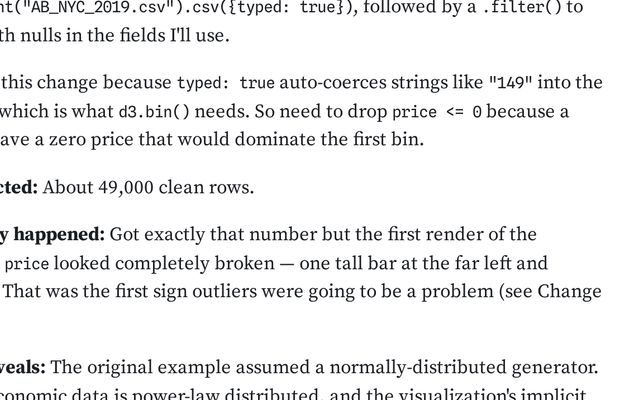
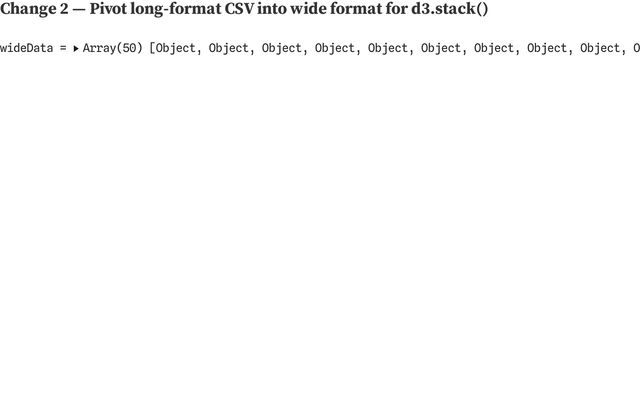
# Adapting a D3 Histogram into a Multi-View Dashboard
Ashish
Apr 6
Bar Chart Race: Walmart Weekly Store Sales
This notebook is a fork
cse478inclass
Apr 6
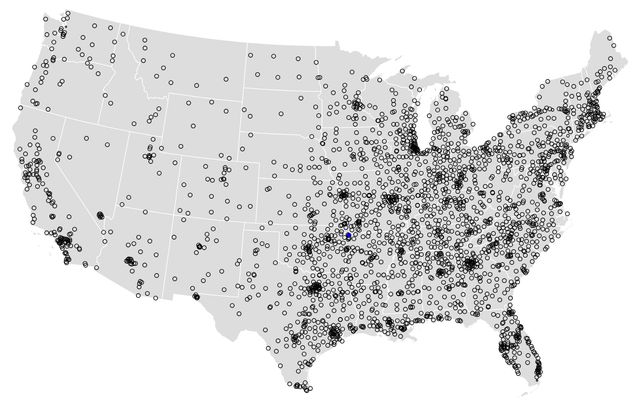
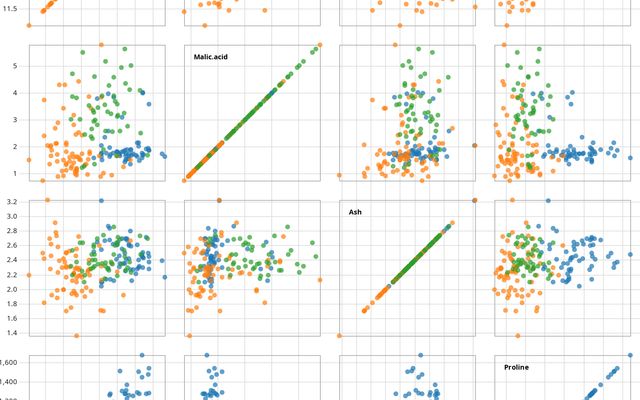
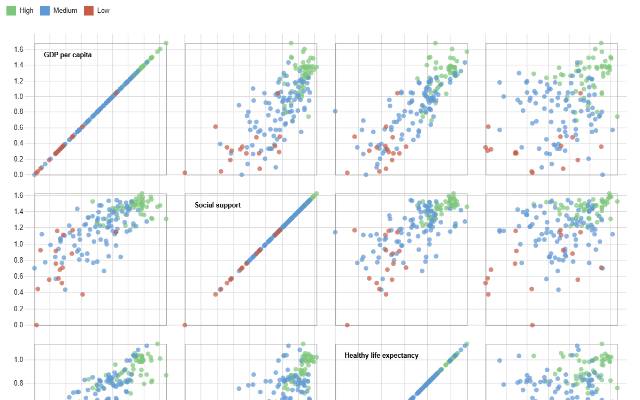
Brushable scatterplot matrix
This notebook is a fork
Keith
Apr 6
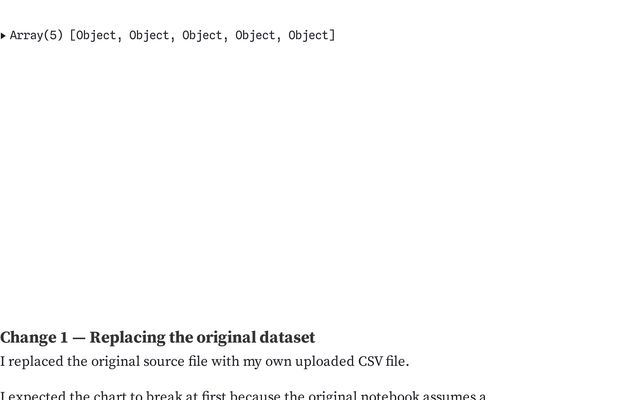
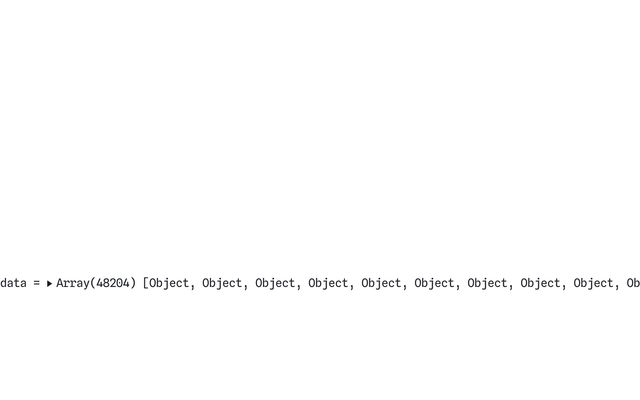
Adapting a D3 Visualization to New Data
Arizona State University
Apr 6
Bar Chart Race
This notebook is a fork
cse478-03.25.26
Apr 6
Adapting a D3 Visualization to New Data
D3 Assignment
Apr 6
Adapting a D3 Visualization to New Data
ASU
Apr 6
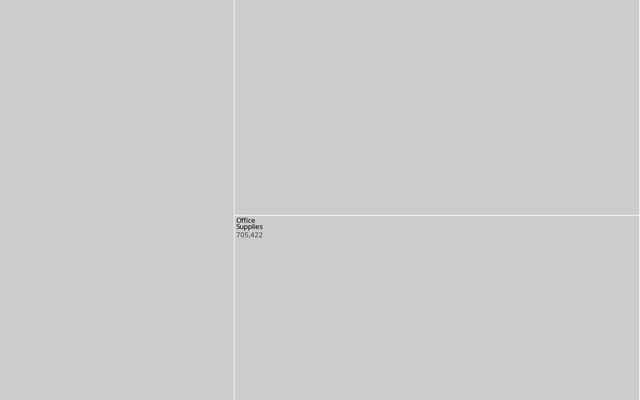
Zoomable treemap
This notebook is a fork
Nitant Trivedi
Apr 6
Adaptinng a D3 Visualization to New Data
Arizona State University
Apr 6
Walmart’s growth
This notebook is a fork
cse478inclass
Apr 6
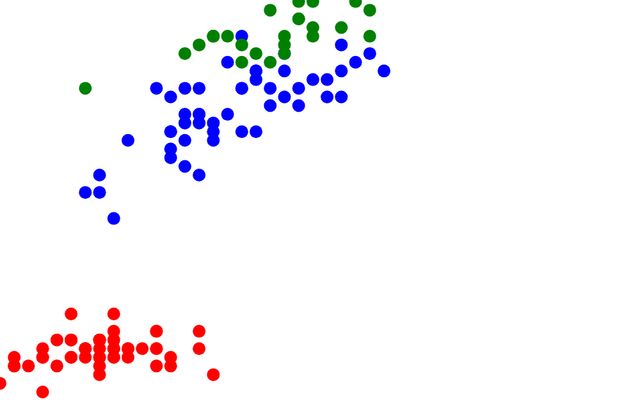
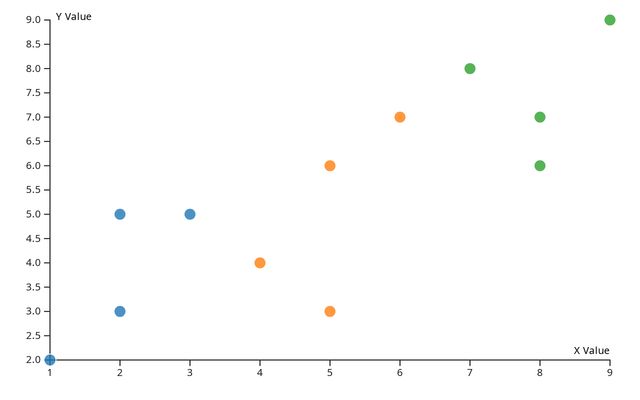
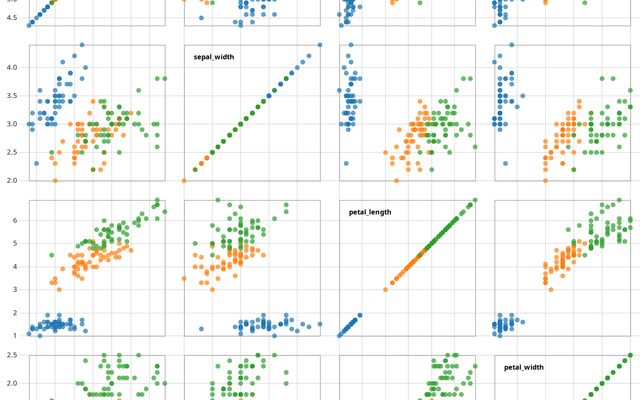
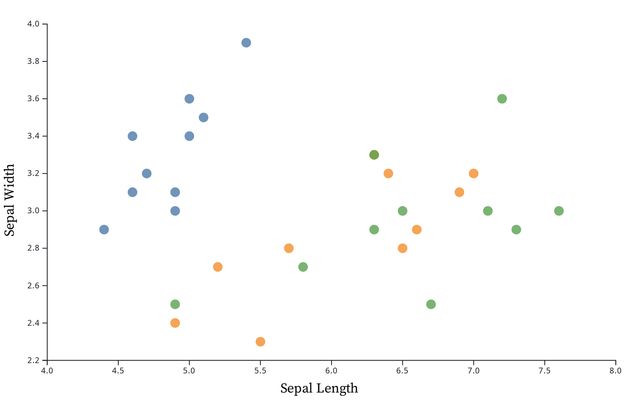
# Adapting a D3 Interactive Scatter Plot to the Iris Dataset
Arizona State University
Apr 6
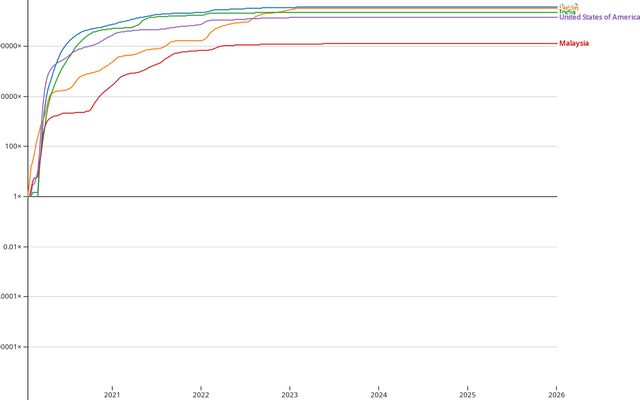
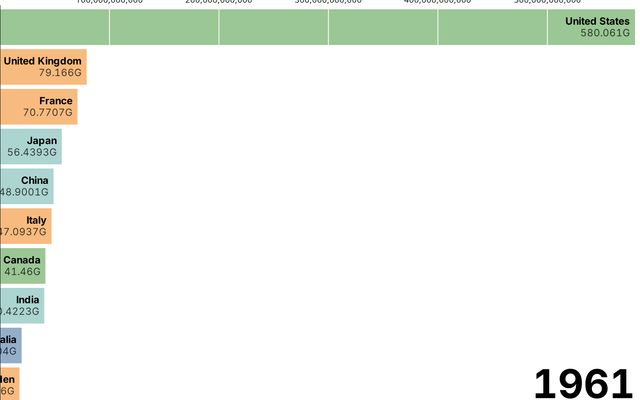
Global GDP Bar Chart Race (2005–2025)
This notebook is a fork
CSE478(spring26)
Apr 6
Adapting a D3 Visualization to New Data
CSE478(spring26)
Apr 6
Assignment: D3 Visualization to New Data
This notebook is a fork
ASU
Apr 6
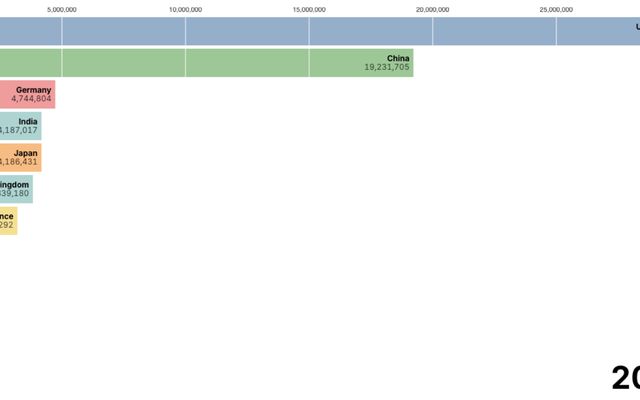
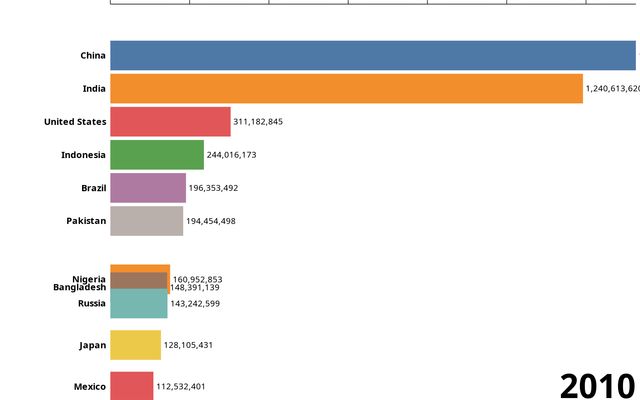
Bar Chart Race – World Population Over Time
This notebook is a fork
school
Apr 6
Shan Sma - Adapting a D3 Visualization to New Data
Spring 2026 - CSE 478
Apr 6
Thanishq Maddela — Adapting a D3 Visualization to New Data
This notebook is a fork
school
Apr 6
Adapting a D3 Visualization to New Data
ASU
Apr 6
•
2
Adapting a D3 Visualization to New Data
observable
Apr 6
Adapting a D3 Visualization to New Data
This notebook is a fork
Sakshi Ritesh Katargamwala
Apr 6
Brushable scatterplot matrix
This notebook is a fork
Arizona state University
Apr 6
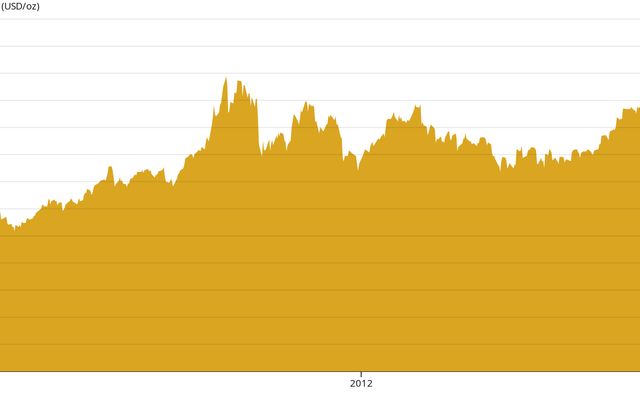
Adapting a Pannable Chart to Gold Price Data
This notebook is a fork
asu
Apr 6
Bar Chart Race
This notebook is a fork
ASU-478
Apr 6
Volcano contours
This notebook is a fork
ASU-478
Apr 6
Adapting a D3 Visualization to New Data by Leya Kolath
Leya Kolath
Apr 6
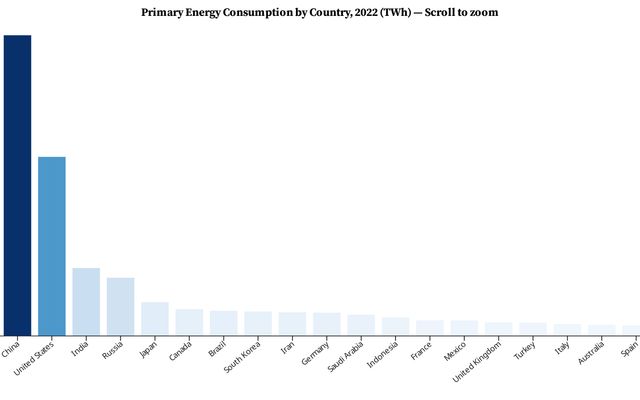
Zoomable bar chart
This notebook is a fork
CSE478 Activity 3.25.26 RW
Apr 6
Adapting a D3 Visualization to New Data
Arizona State University
Apr 6
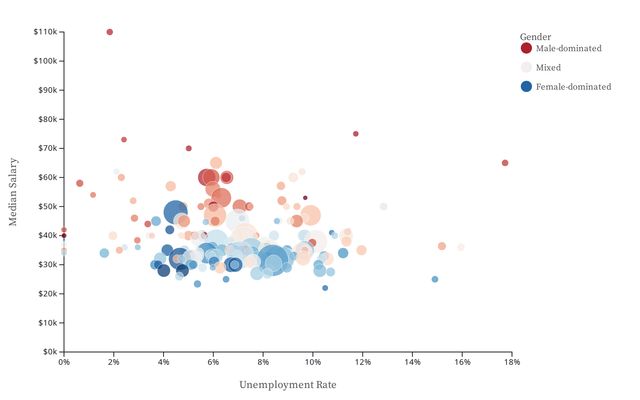
What's Your Major Worth?
Danielle Carrol
Apr 6
Heart Disease Brushable Scatterplot Matrix
This notebook is a fork
Visualizations
Apr 6
Showing
241-270
of
10,000
notebooks
Prev
Next