Platform
Resources
Pricing
Sign in
Get started
Trending
Recent
Most stars last month
Most stars all time
Recent
Showing
61-90
of
10,000
notebooks
Prev
Next
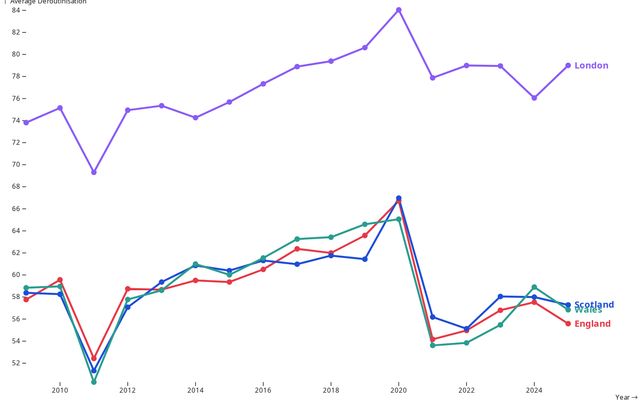
DEROUTINISATION OF JOBS: Countries' Average 2009-2025
This notebook is a fork
GWM 2026
Apr 9
Distribución Espacial de los Apellidos en Puerto Rico - Plantilla
This notebook is a fork
AN G
Apr 9
Distribución Espacial de los Apellidos en Puerto Rico - Plantilla
apellidospr
Apr 9
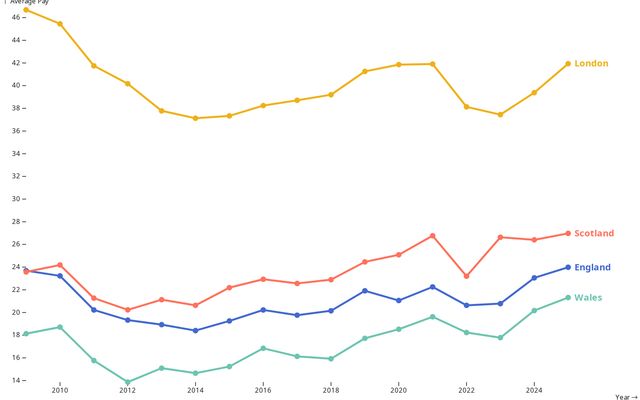
MEDIAN WEEKLY PAY: Countries' Average 2009-2025
GWM 2026
Apr 9
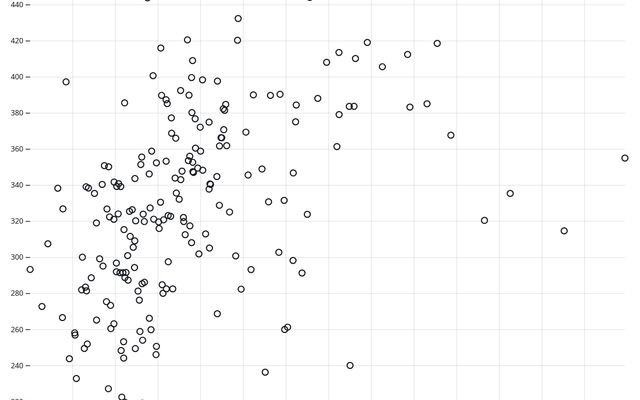
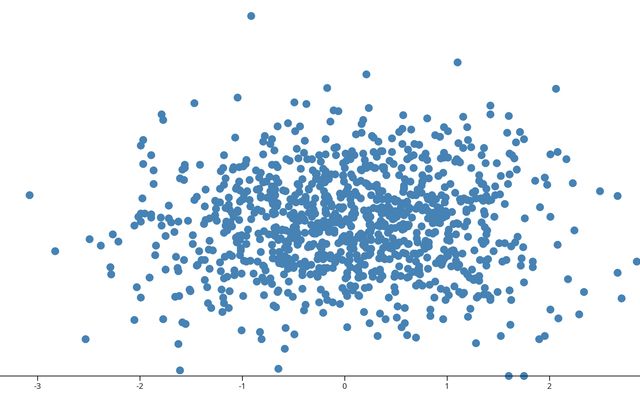
Productivity VS TOTAL SCORE - Great Britain (D3 scatterplot)
This notebook is a fork
GWM 2026
Apr 9
D3 Interaction
This notebook is a fork
GVSU
Apr 9
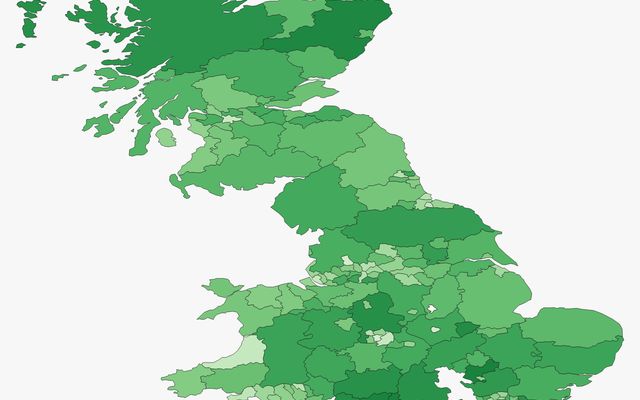
MAP Good Work Time Series- PRODUCTIVITY PER HOUR, 2009-2023
This notebook is a fork
GWM 2026
Apr 9
MAP Good Work Time Series- PROFESSIONAL JOBS, 2009-2025
This notebook is a fork
GWM 2026
Apr 9
MAP Good Work Time Series- SATISFACTORY HOURS, 2009-2025
This notebook is a fork
GWM 2026
Apr 9
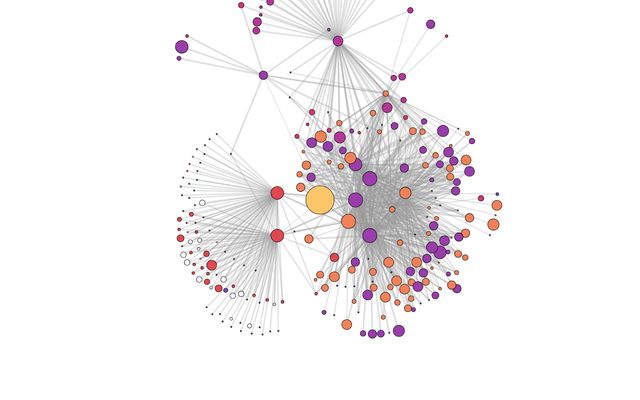
Force-directed graph
This notebook is a fork
Networks
Apr 9
MAP Good Work Monitor - ECONOMIC ACTIVITY, 2009-2025
This notebook is a fork
GWM 2026
Apr 9
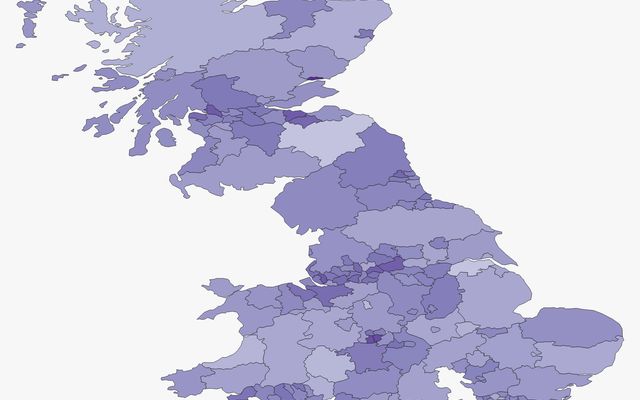
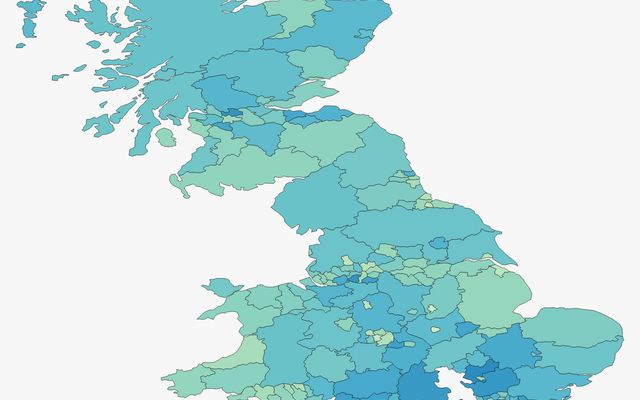
MAP Good Work Time Series- TOTAL SCORE, 2009-2025
This notebook is a fork
GWM 2026
Apr 9
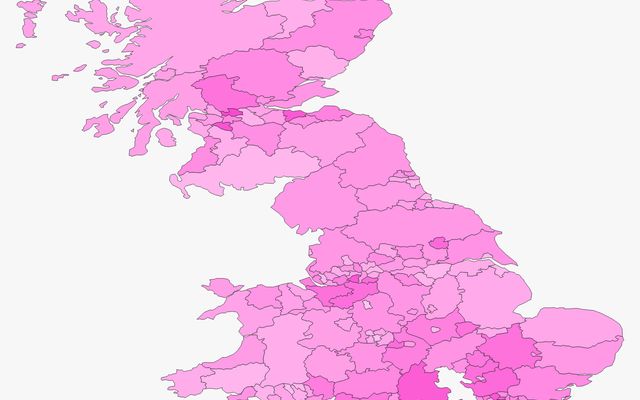
MAP Good Work Monitor - DEROUTINISATION OF JOBS, 2009-2025
GWM 2026
Apr 9
D3 Interaction
Grand Valley State University
Apr 9
Plot Element Values
Fabian Iwand
Apr 9
•
4
Bar Chart Médecin par région
Data Viz APP5
Apr 9
Plot: Projection domain
This notebook is a fork
Rose et Astre
Apr 9
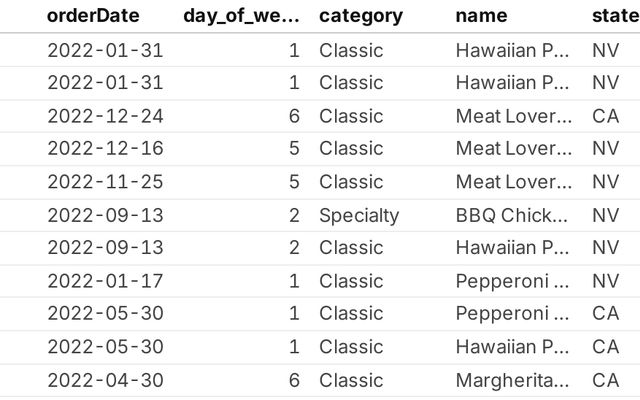
Pizza Orders Visual Exploration
Tyler Randall - Data Visualization
Apr 9
Learning Vis Tools Tutorial 8: Visualization with D3.js
This notebook is a fork
Data Visualization
Apr 9
Learning Vis Tools Tutorial 8: Visualization with D3.js
This notebook is a fork
TroyFeng
Apr 9
Zoom to bounding box
This notebook is a fork
LOCKED
Apr 9
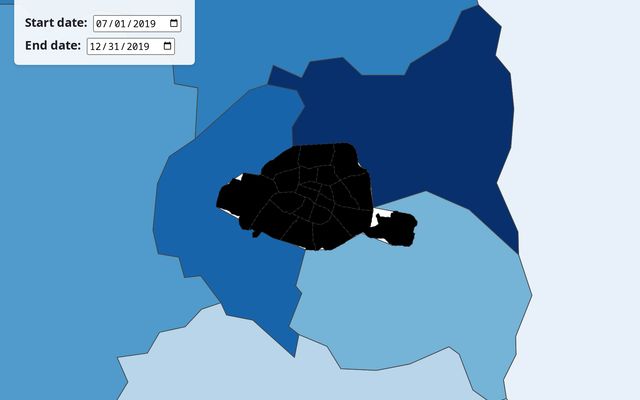
Anatomy of public transport in Paris
This notebook is a fork
Data visualization - Polytech
Apr 9
Walmart’s growth
This notebook is a fork
Waldek Węgrzyn
Apr 9
Learning Vis Tools Tutorial 8: Visualization with D3.js
This notebook is a fork
workspace
Apr 9
Introduction to data wrangling and analysis in JavaScript - Session 4 Follow-along…
Data Visualization
Apr 9
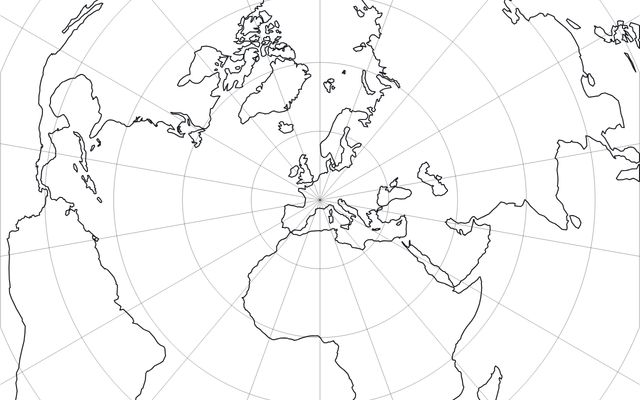
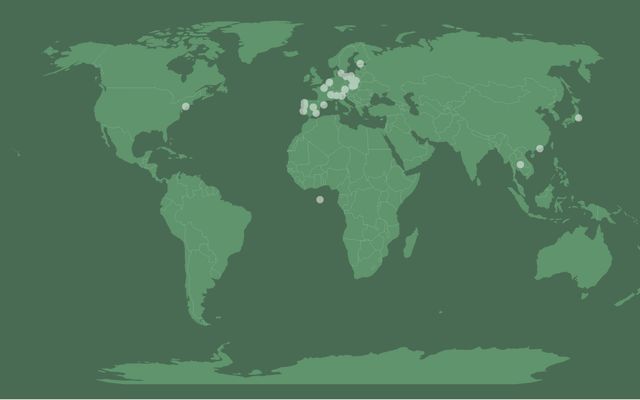
Plot World Map
This notebook is a fork
Peter's Workspace
Apr 9
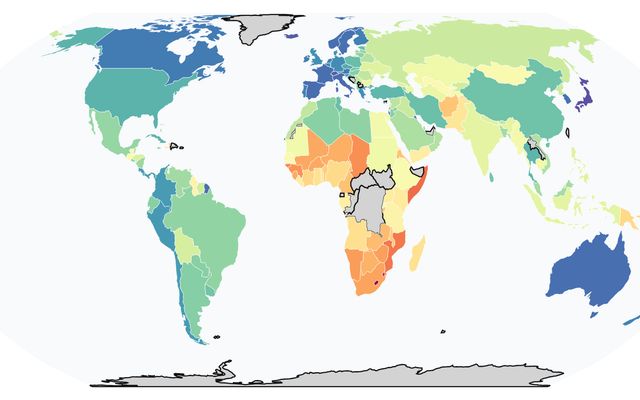
Plot World Map Cartogram
This notebook is a fork
Peter's Workspace
Apr 9
Introduction to data wrangling and analysis in JavaScript - Session 3 Follow-along…
Data Visualization
Apr 9
Introduction to data wrangling and analysis in JavaScript — Session 2 follow-along…
Data Visualization
Apr 9
Introduction to data wrangling and analysis in JavaScript — Session 1 Follow-along…
Data Visualization
Apr 9
Showing
61-90
of
10,000
notebooks
Prev
Next