Platform
Resources
Pricing
Sign in
Get started
Trending
Recent
Most stars last month
Most stars all time
Recent
Showing
211-240
of
10,000
notebooks
Prev
Next
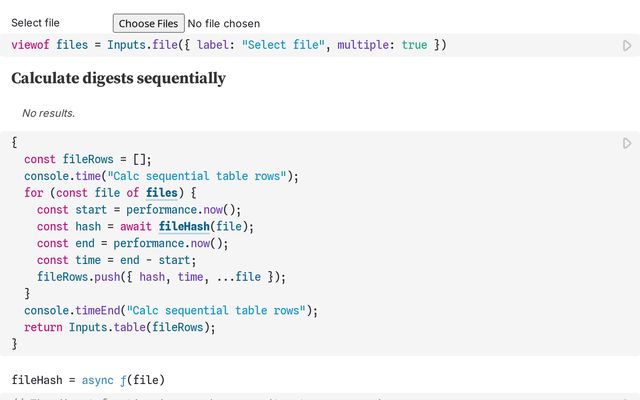
Subtle Crypto SHA-256
Ross Mills
Apr 7
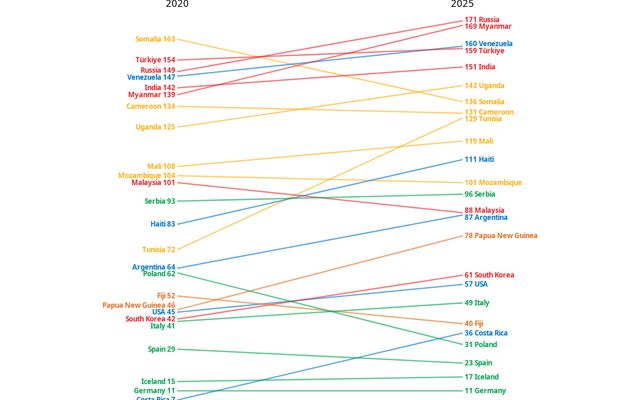
Press Freedom Index 2020-2025
Éléonore
Apr 7
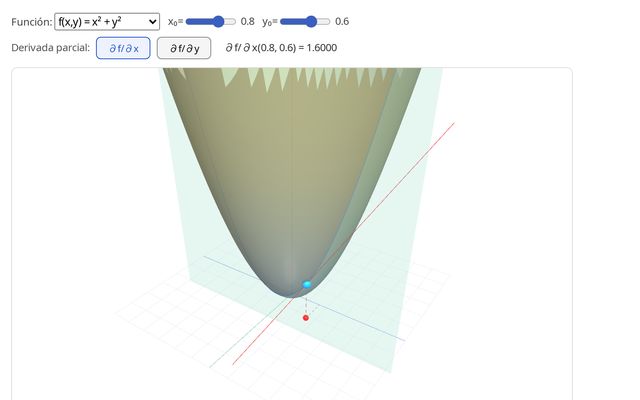
Derivadas parciales
x
Apr 7
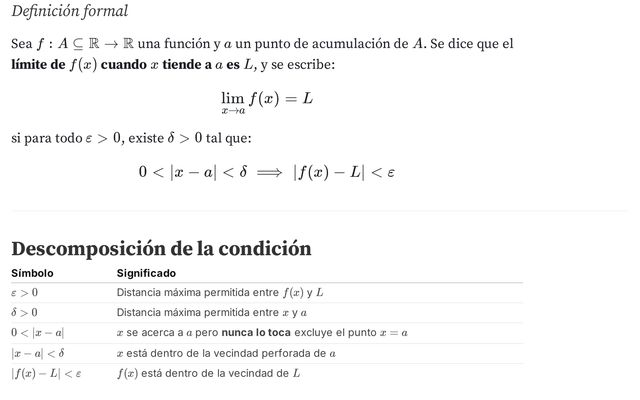
Definición de Límite (ε–δ)
x
Apr 7
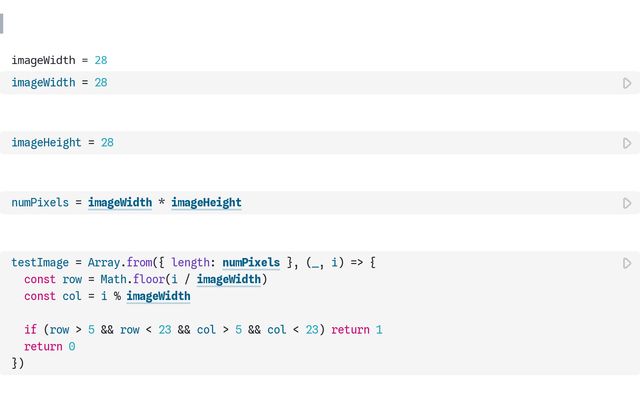
Image Genration
Mohd Robiul Alam
Apr 7
<!DOCTYPE html>
18
Apr 7
<!DOCTYPE html>
18
Apr 7
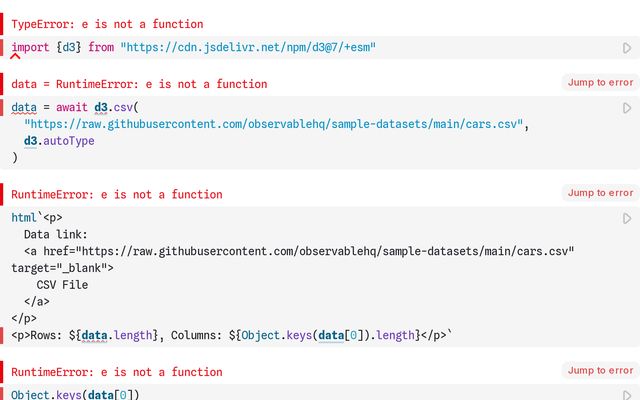
Reusable D3
Hhhhtian
Apr 7
Assignment 2
CSCE 5320
Apr 7
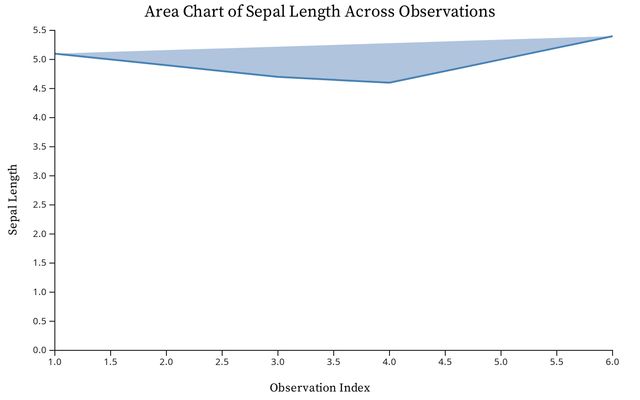
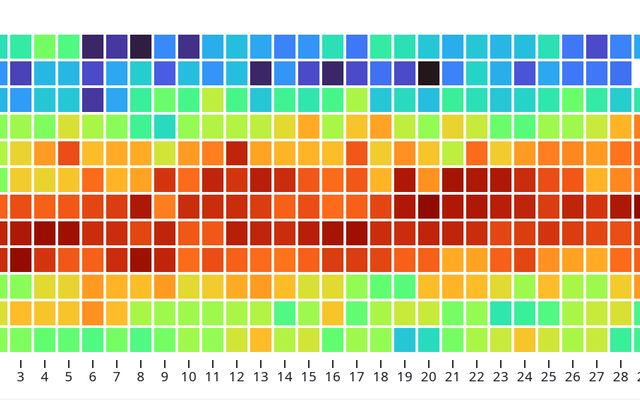
Area Chart Using Iris Dataset
Scientific-Data-Visualisation
Apr 7
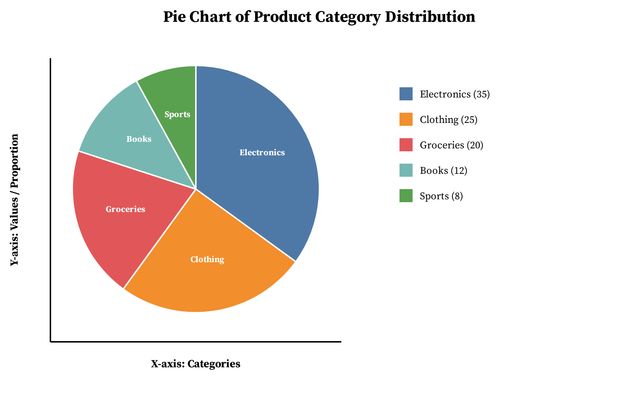
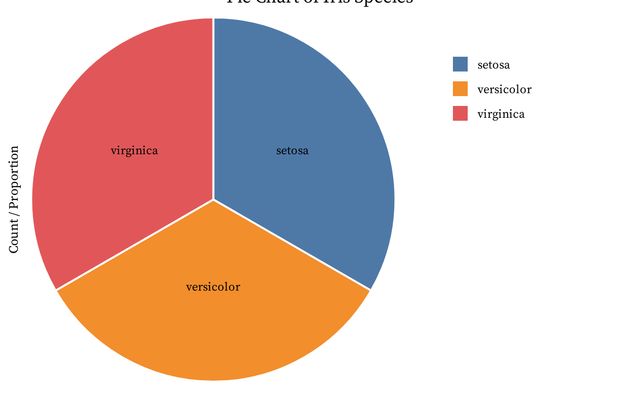
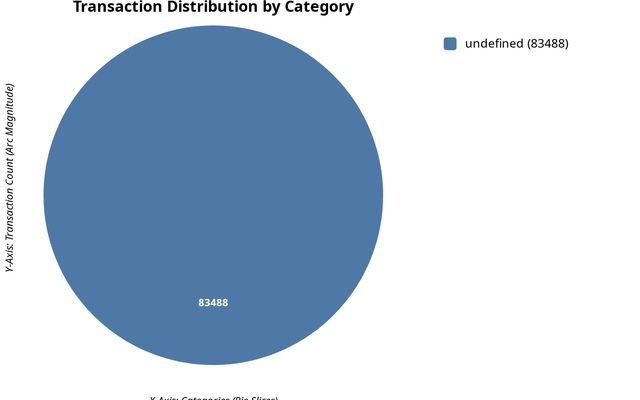
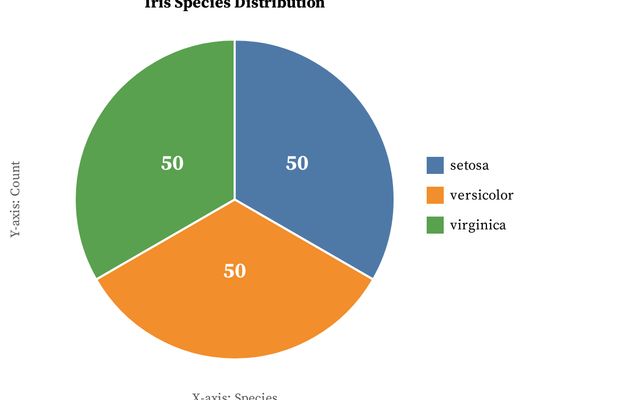
Pie Chart Using Iris Dataset
Scientific-Data-Visualisation
Apr 7
Assignment_2 Q2
Unt
Apr 7
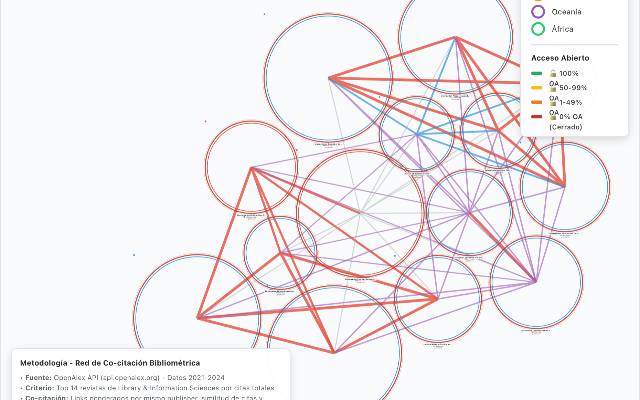
Red de Co-citación WebGL
Kevin Gutierrez
Apr 7
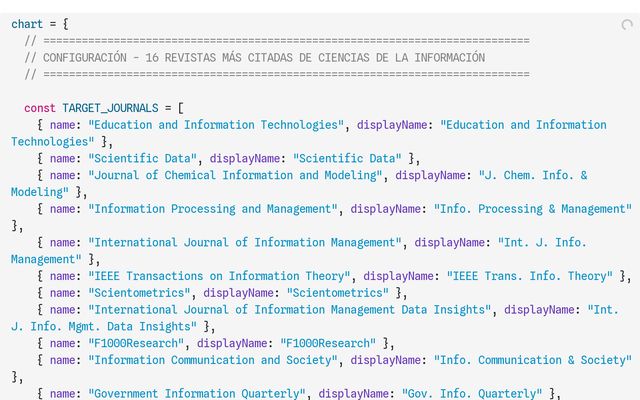
MAPA DE CO-OCURRENCIA DE TEMAS EN CIENCIAS DE LA INFORMACIÓN V. 3.0
Kevin Gutierrez
Apr 7
Assignment_2 Q1
Unt
Apr 7
Session 1: Introduction to Observable Plot (Follow-along version)
This notebook is a fork
Visual Analytics
Apr 6
Vertical Park - Yvanna, Jing
hower_teaching
Apr 6
From War to Grocery Store
Maddux's Workspace
Apr 6
•
1
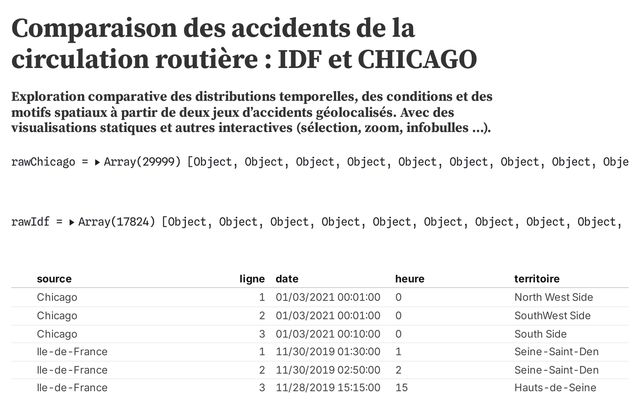
Comparaison des accidents de la circulation routière : IDF et CHICAGO
Mortada bouzaffour
Apr 6
Assignment 2 D3.js pie chart
UNT
Apr 6
Arc diagram
This notebook is a fork
reuben
Apr 6
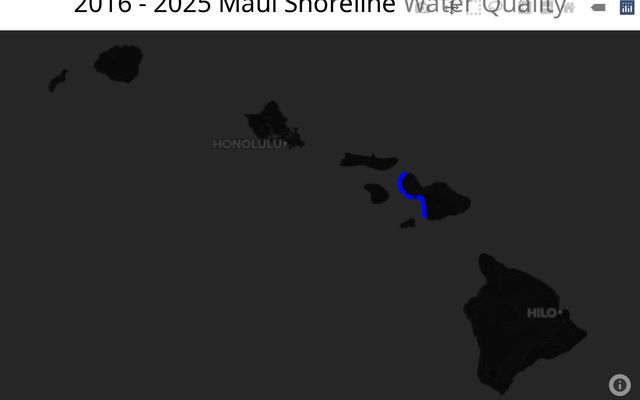
Maui Map
ICS 684
Apr 6
Introdução ao D3 com Observable (Parte 1)
This notebook is a fork
Jamires
Apr 6
Introdução ao D3 com Observable (Parte 1)
This notebook is a fork
Visualização
Apr 6
Introdução ao D3 com Observable (Parte 1)
This notebook is a fork
new workspace
Apr 6
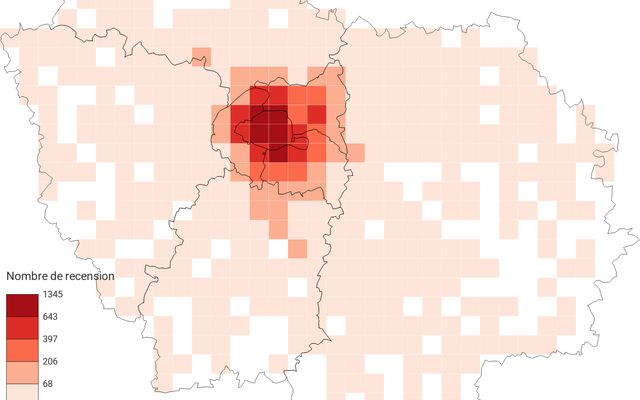
Visualisation d'accidents de voiture en Ile de France
personel
Apr 6
•
1
Introdução ao D3 com Observable (Parte 1)
This notebook is a fork
J Henrique
Apr 6
Introdução ao D3 com Observable (Parte 1)
This notebook is a fork
lfurtado
Apr 6
Introdução ao D3 com Observable (Parte 1)
This notebook is a fork
VisualizacaoDeDados
Apr 6
Introdução ao D3 com Observable (Parte 1)
This notebook is a fork
data-visualization
Apr 6
Showing
211-240
of
10,000
notebooks
Prev
Next