Platform
Resources
Pricing
Sign in
Get started
Trending
Recent
Most stars last month
Most stars all time
Recent
Showing
1-30
of
10,000
notebooks
Prev
Next
Red de Co-citación WebGL
Kevin Gutierrez
Apr 7
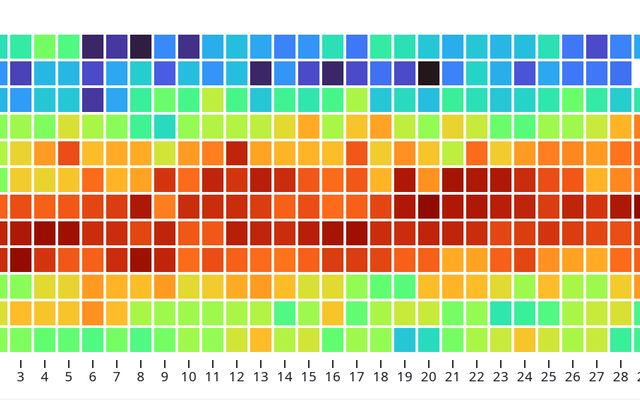
Session 1: Introduction to Observable Plot (Follow-along version)
This notebook is a fork
Visual Analytics
Apr 6
Vertical Park - Yvanna, Jing
hower_teaching
Apr 6
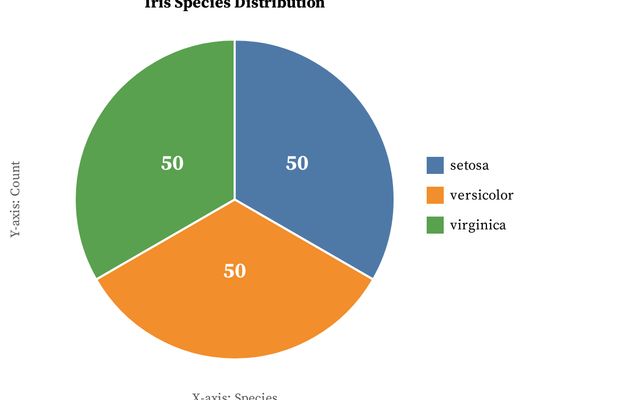
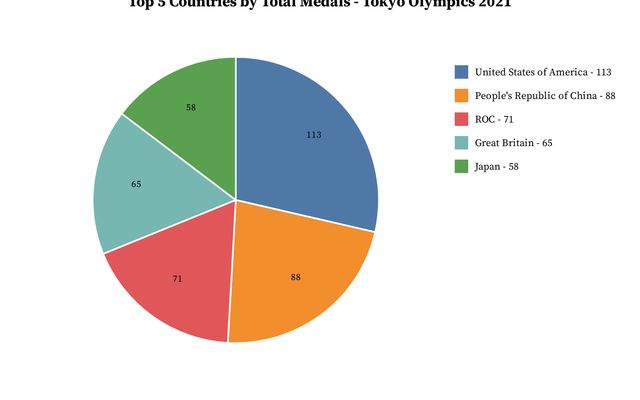
Assignment 2 D3.js pie chart
UNT
Apr 6
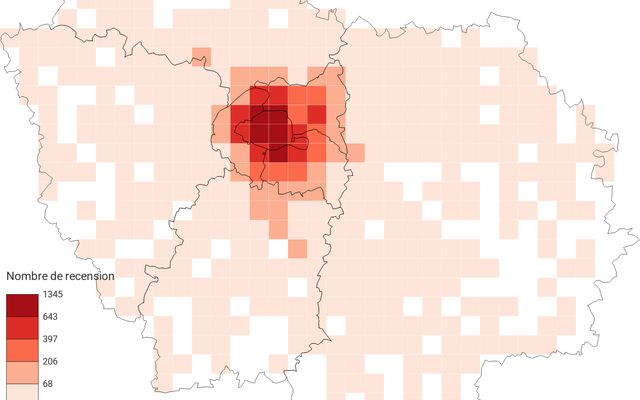
Visualisation d'accidents de voiture en Ile de France
personel
Apr 6
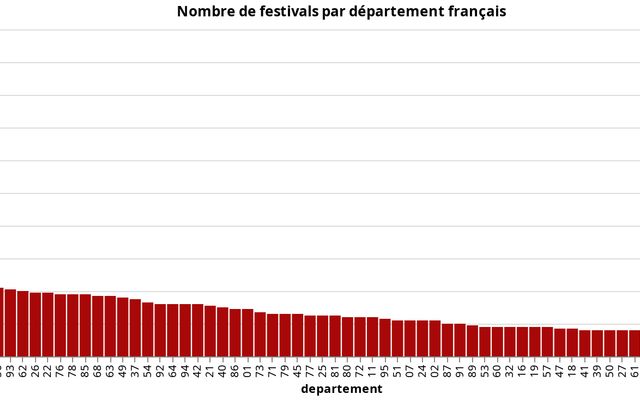
Visualisation des festivals en France
seb
Apr 6
1.5 TP-3: Introducción a Observable y D3
This notebook is a fork
Leo Serpa
Apr 6
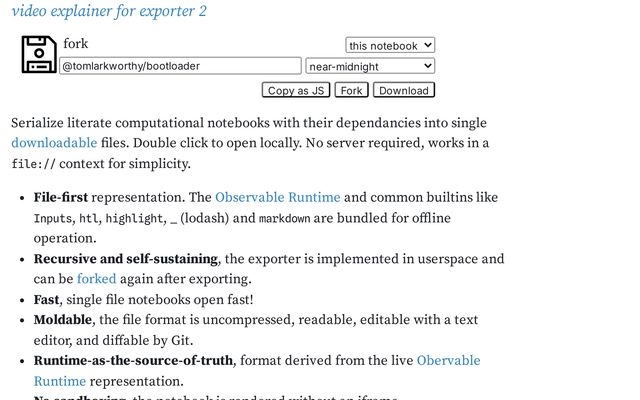
Exporter 3
Tom Larkworthy
Apr 6
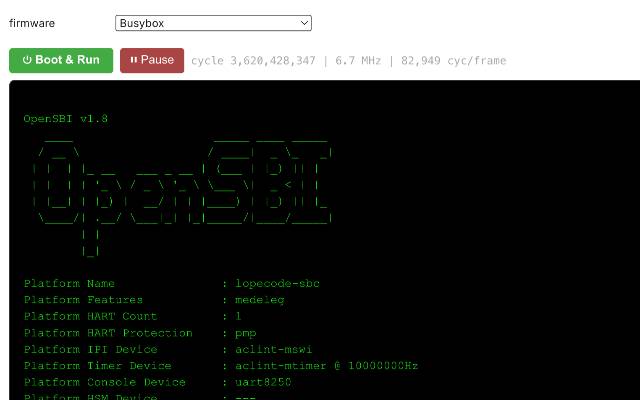
RISC-V Linux BusyBox Single Board Computer
Tom Larkworthy
Apr 6
•
2
Visualisation de feux de forêt en Corse
Geodata Paris
Apr 6
•
1
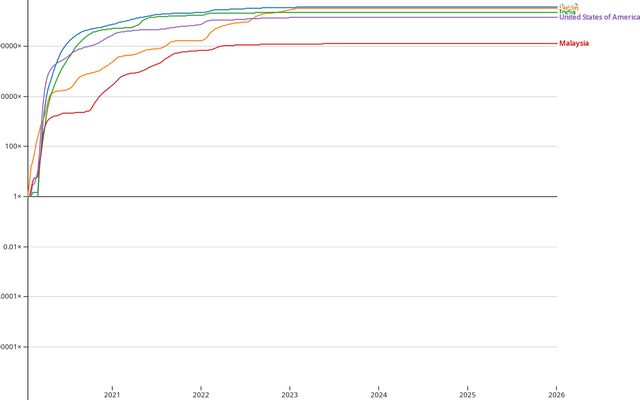
Starbucks Growth across the World -- CSE478 Assignment
This notebook is a fork
CSE478-2026
Apr 6
Question 2
Rubel
Apr 6
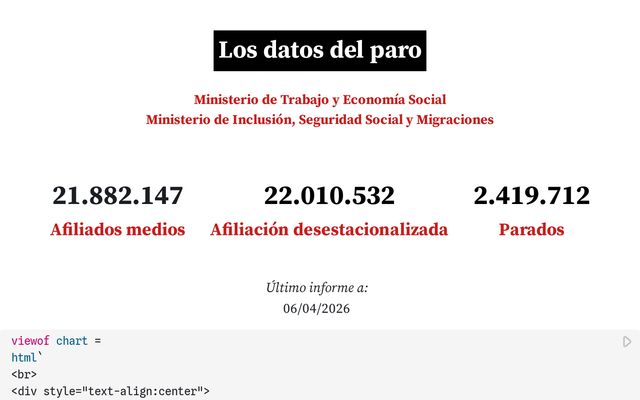
Los datos del paro
Newtral Data
Apr 6
Question#1
Rubel
Apr 6
The Polaris Disc — A Celestial Music Box
This notebook is a fork
Nicks Perspective
Apr 6
•
1
UntitledWhy Princess Cut Diamond Rings Feel Sharp, Modern, and Bold
michelvilsen
Apr 6
Untitled## Section 1 — Original Visualization
Divyansh
Apr 6
Adapting a D3 Visualization to New Data
krishnasowrkspace
Apr 6
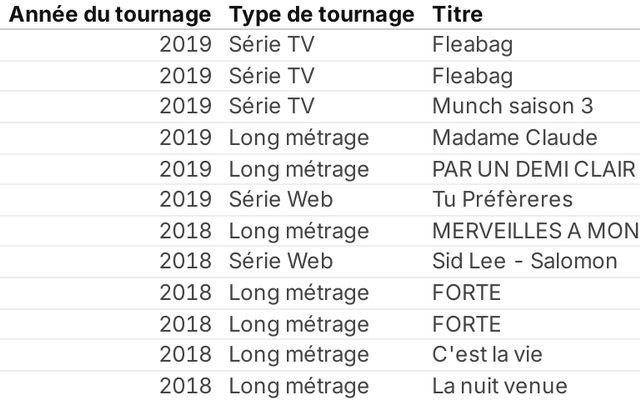
Visualisation des lieux de tournage à Paris
personal
Apr 6
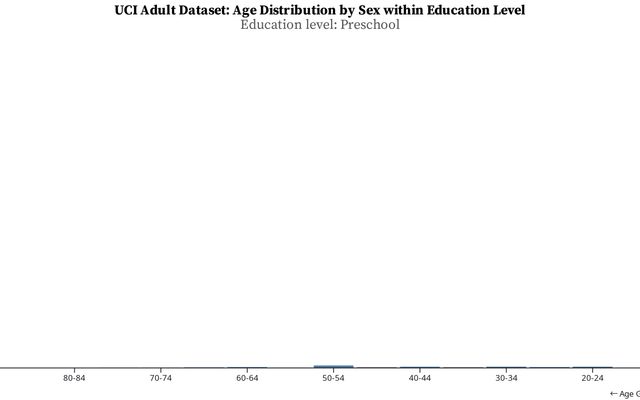
Adapting an Animated Population-by-Age D3 Visualization to the UCI Adult Dataset
ASU
Apr 6
# Adapting a D3 Visualization to New Data
Arizona State University
Apr 6
Section 1
In Class
Apr 6
Assignment 2 by S M Mazharul Hoque Chowdhury (Part 2)
University of North Texas
Apr 6
# Adapting a D3 Histogram into a Multi-View Dashboard
Ashish
Apr 6
Bar Chart Race: Walmart Weekly Store Sales
This notebook is a fork
cse478inclass
Apr 6
Brushable scatterplot matrix
This notebook is a fork
Keith
Apr 6
Adapting a D3 Visualization to New Data
Arizona State University
Apr 6
Bar Chart Race
This notebook is a fork
cse478-03.25.26
Apr 6
Adapting a D3 Visualization to New Data
D3 Assignment
Apr 6
Adapting a D3 Visualization to New Data
ASU
Apr 6
Showing
1-30
of
10,000
notebooks
Prev
Next