Platform
Resources
Pricing
Sign in
Get started
Trending
Recent
Most stars last month
Most stars all time
Recent
Showing
2,071-2,100
of
10,000
notebooks
Prev
Next
Bar Chart Race
Videók
Feb 15
Assignment 3: Interactive Visualization
This notebook is a fork
rvenka|UW|CSE442
Feb 15
Interactive Visualization Used Cars Market
FH OÖ: Big Data Visualization
Feb 15
Assignment 2: Classification and Colors - Elif
This notebook is a fork
ekorkmaz
Feb 20
Interactive SVG
This notebook is a fork
LiveDataStreaming
Feb 14
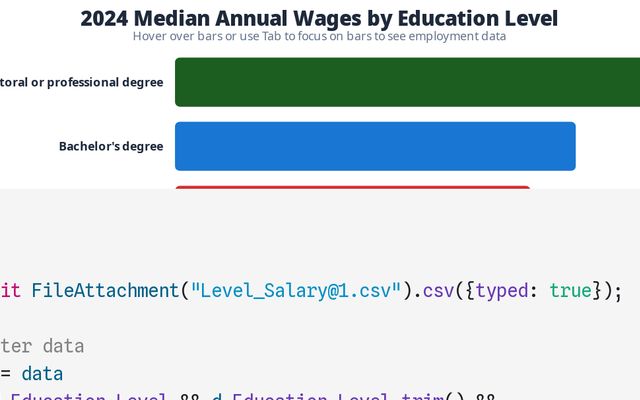
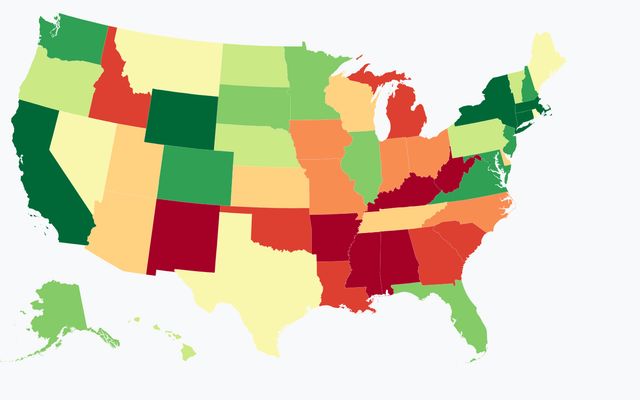
Is college worthy it
Yi Zeng
Feb 14
Simple D3
This notebook is a fork
desis
Feb 14
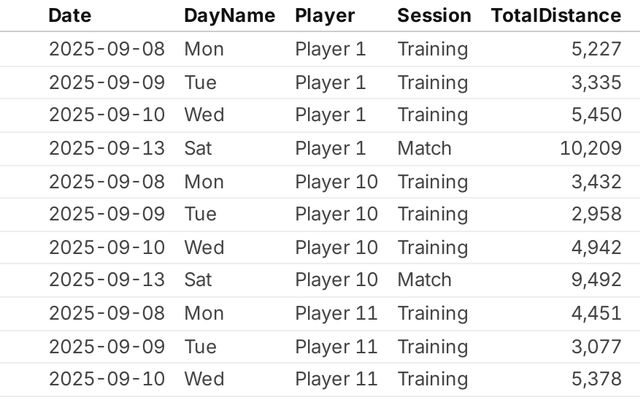
Sports Data Analytics: Football Load Management Tool
Noqe
Feb 14
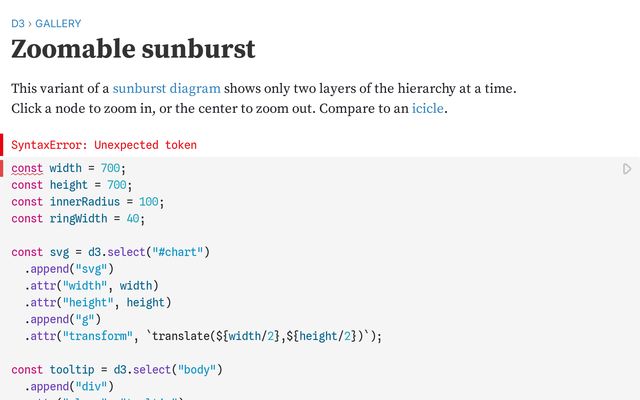
Zoomable sunburst
This notebook is a fork
First project
Feb 14
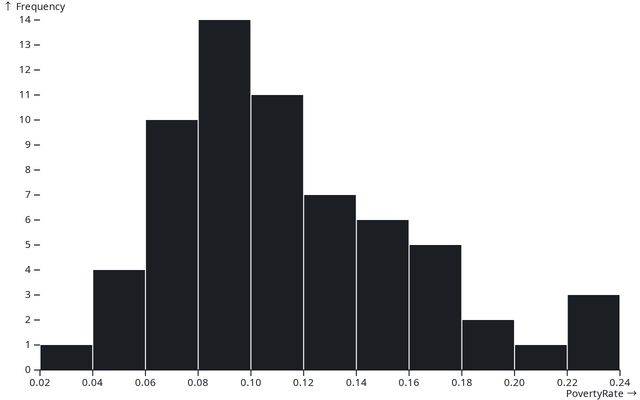
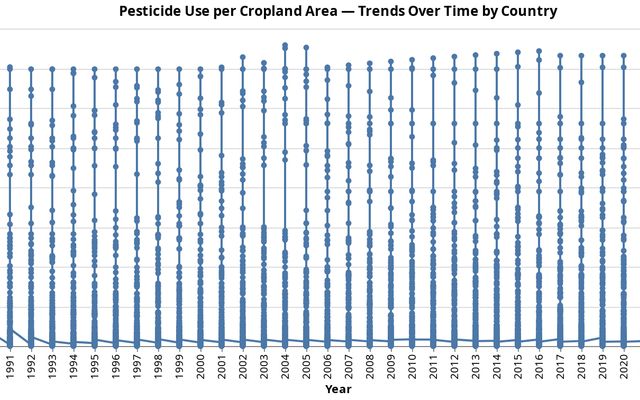
Does More Pesticide Always Mean More Yield?
This notebook is a fork
IvonneZ
Feb 14
Ivonne and Don Final Project
Final Project
Feb 14
Making Visualizations with Vegalite (2026)
Simon Fraser University
Feb 14
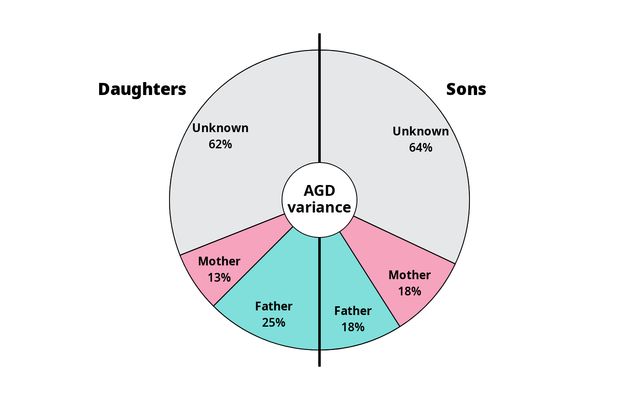
Mice AGD
This notebook is a fork
SynoSys
Feb 14
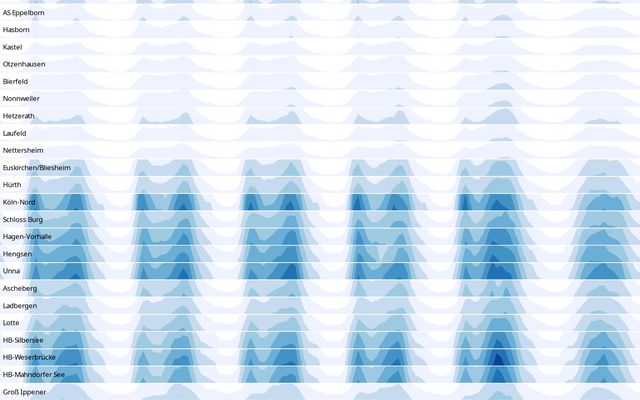
Horizon chart
This notebook is a fork
LiangweiOIO
Feb 14
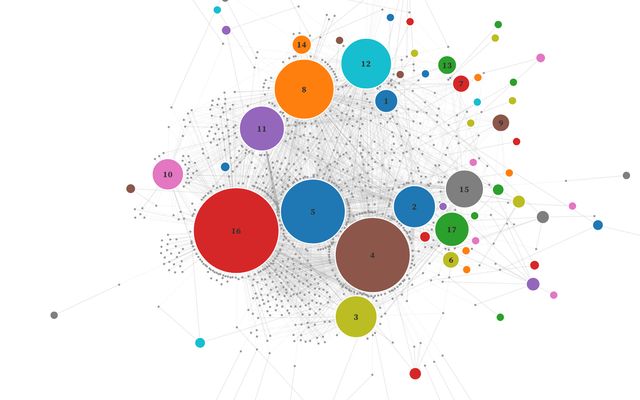
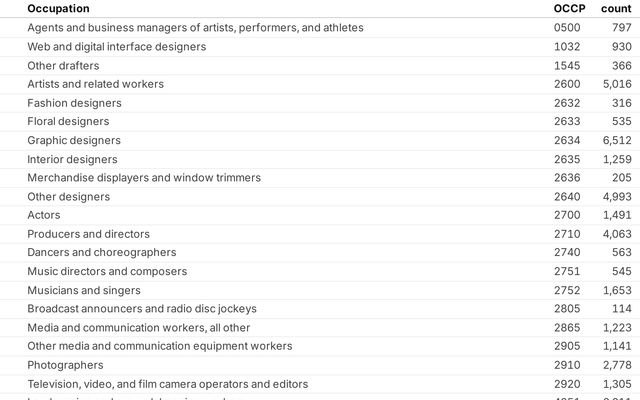
Enumerating Arts Workers
Zach Pino
Feb 14
•
1
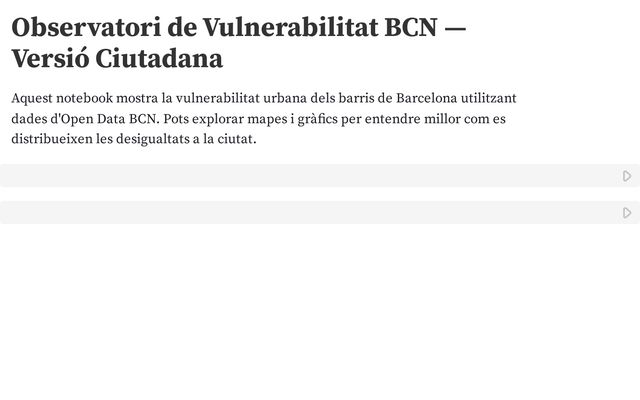
Barcelona Data Experience
Fem
Feb 14
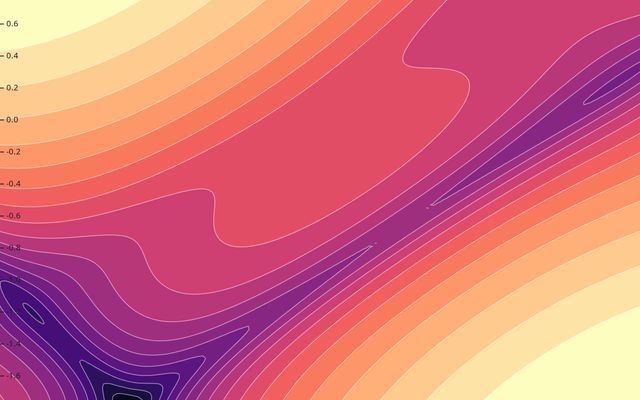
Contours
This notebook is a fork
Pedro Test
Feb 14
U.S. Personal Income per Capita by State (1929-2024) and County (1969-2024)
Test
Feb 13
Attach masks
Allmaps
Feb 13
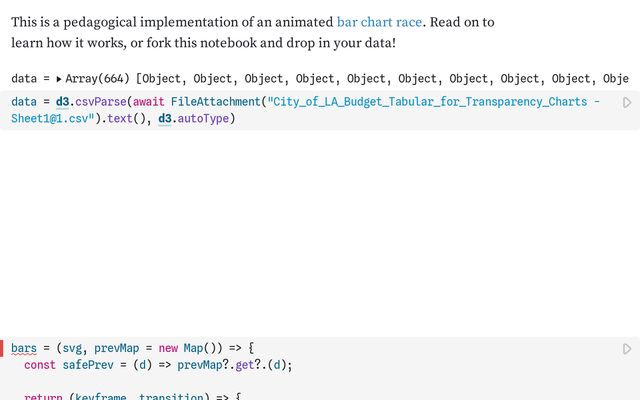
Bar Chart Race, Explained
This notebook is a fork
ctrl
Feb 13
Hola, mundo <3
CZ
Feb 13
Simple D3
This notebook is a fork
Arup
Feb 13
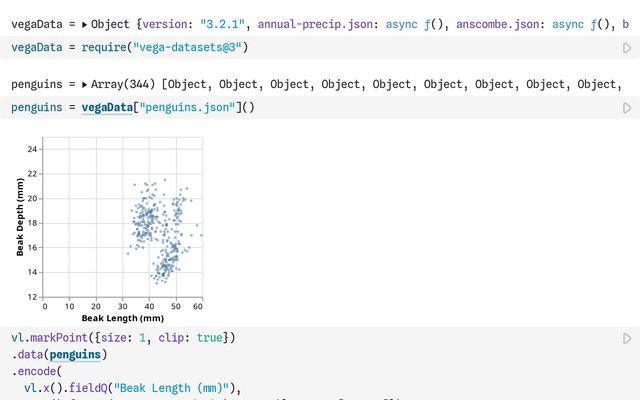
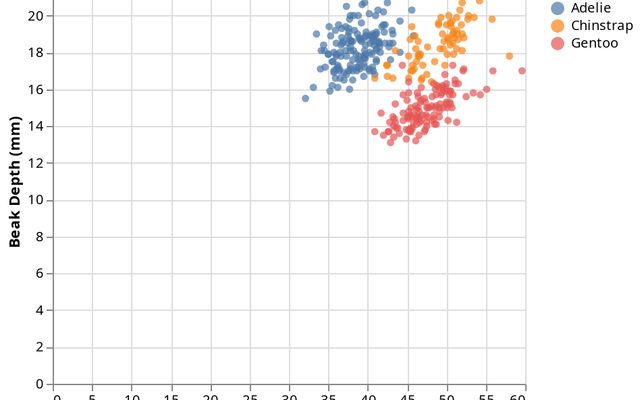
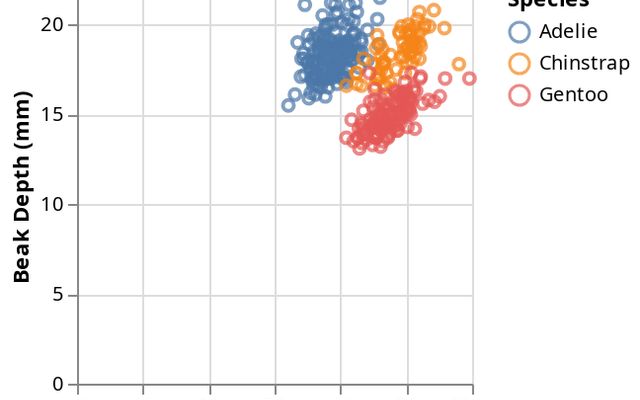
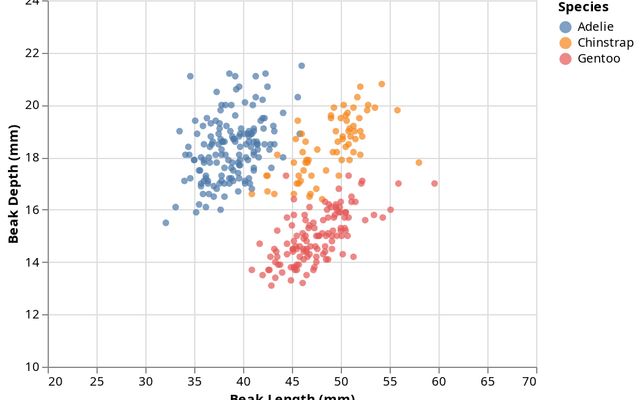
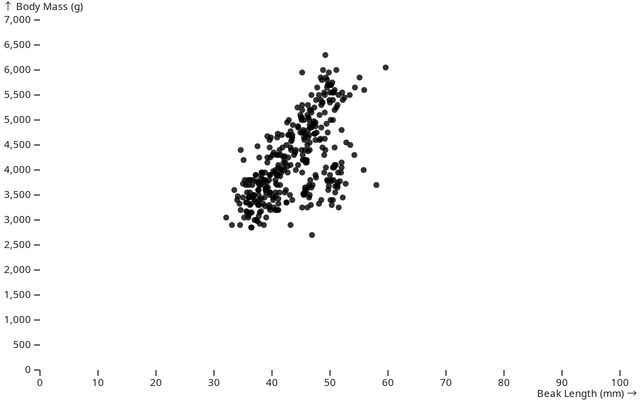
PenguinsNotebook
Data Visualization
Feb 13
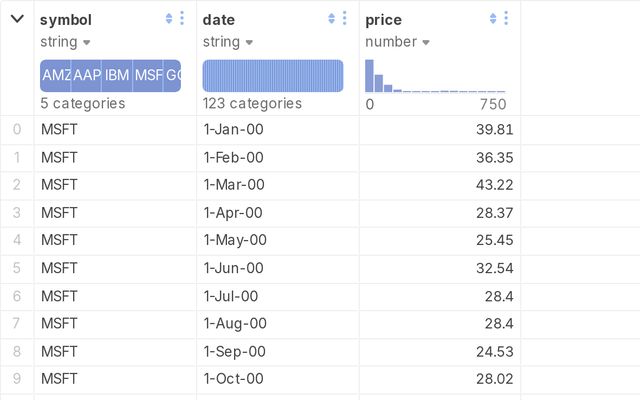
data wrangling
Syracuse University
Feb 13
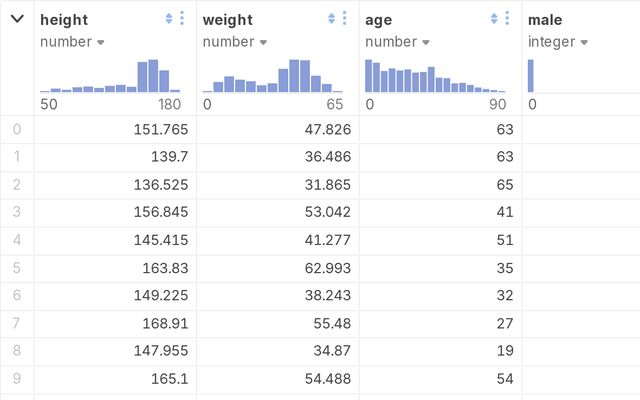
EDA height/weight
Syracuse University
Feb 13
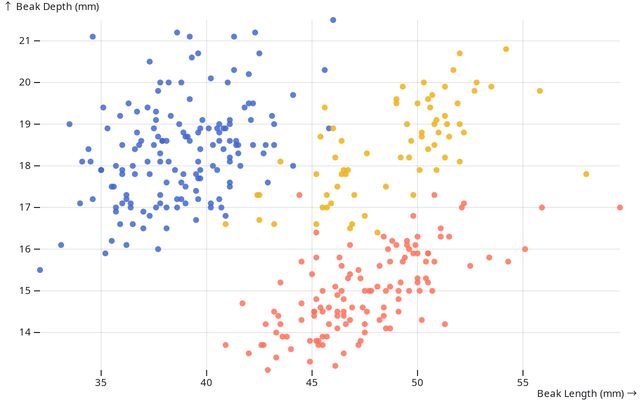
Recitation Assignment 4: EDA Penguins
Josh Lim
Feb 13
lab4
Data Visualization Class
Feb 13
EDA Penguins
first-workspace
Feb 13
EDA Penguins
Data Vistualization
Feb 13
penguins.json
gfparra
Feb 13
Showing
2,071-2,100
of
10,000
notebooks
Prev
Next