Platform
Resources
Pricing
Sign in
Get started
Trending
Recent
Most stars last month
Most stars all time
Recent
Showing
31-60
of
10,000
notebooks
Prev
Next
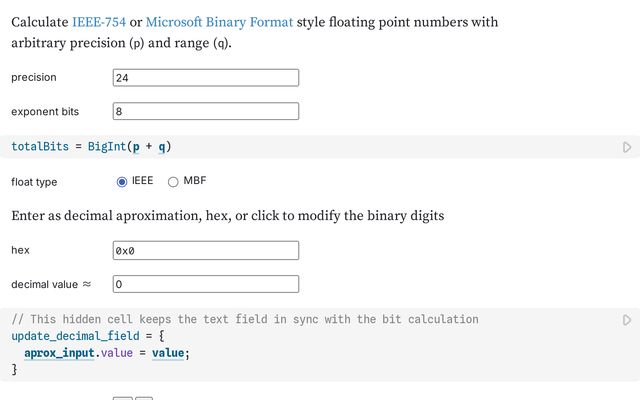
Floating Point Calculator
This notebook is a fork
D3 visualiser
Apr 5
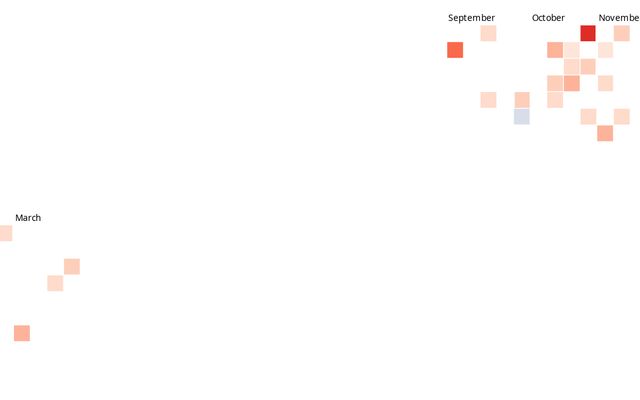
Adapting a D3 Visualization to New Data
ASU
Apr 5
Adapting D3's Walmart Growth to US Tornado Data
Pranav Aratikatla
Apr 4
Шлях ВПО (дані з ЄІССС)
This notebook is a fork
Ukrainian Catholic University
Apr 4
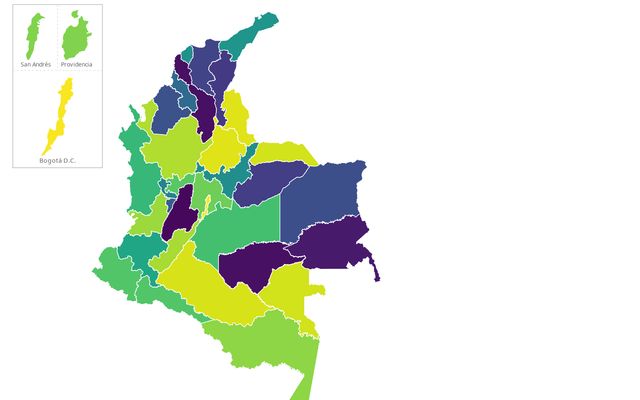
prueba Mapa 1
David Zamora
Apr 4
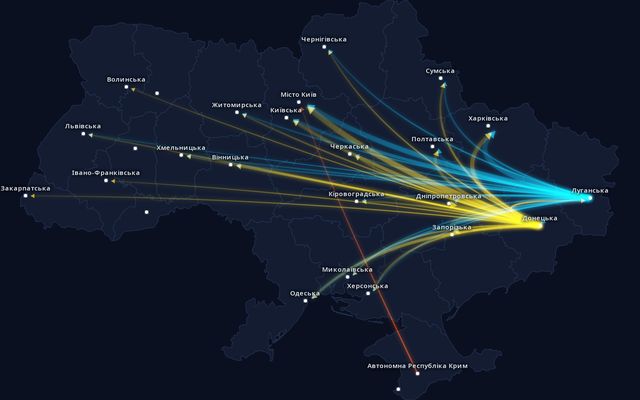
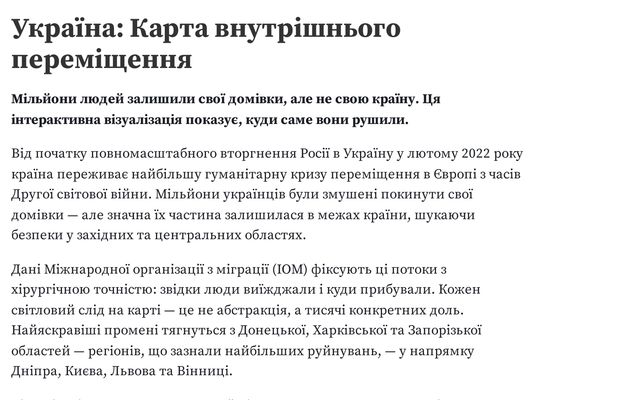
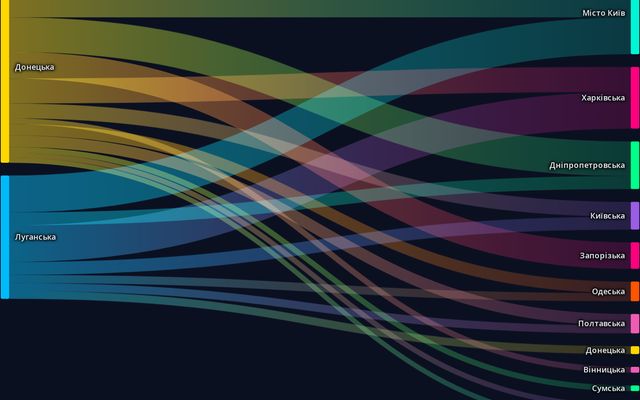
Україна: Карта внутрішнього переміщення
Test
Apr 3
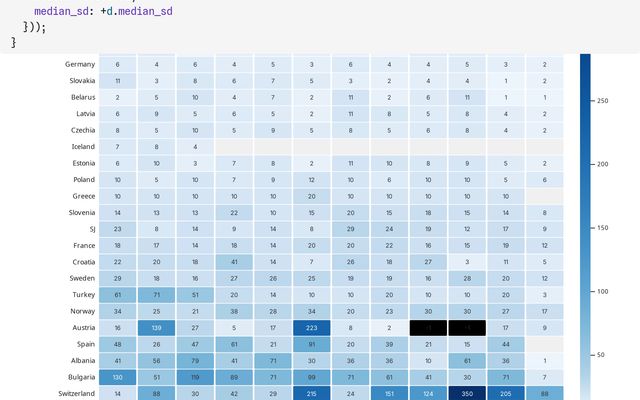
Daily snow depth SD
Test
Apr 3
Data Visualization Duplication
Test
Apr 3
d3 = require("d3@7")
population per continent in 2022
Apr 3
Course Project
ucu
Apr 3
Project
UCU
Apr 3
Статистика повітряних тривог за 2022-2025 роки
Назарій Івасишин
Apr 3
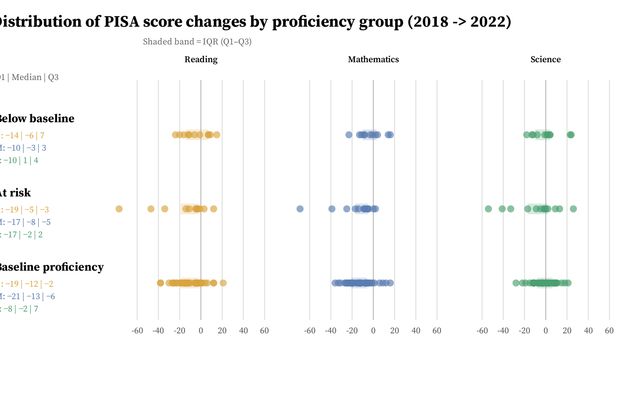
PISA - distribution changes
This notebook is a fork
UCU
Apr 3
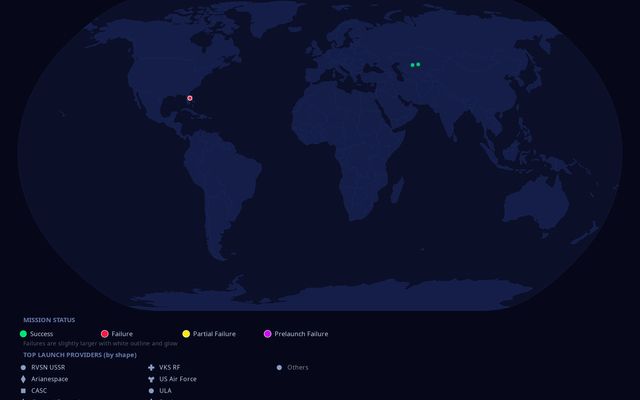
Space war
Вадим Павлик
Apr 3
Шлях ВПО
Ukrainian Catholic University
Apr 4
US military strikes in the Caribbean
Éléonore
Apr 3
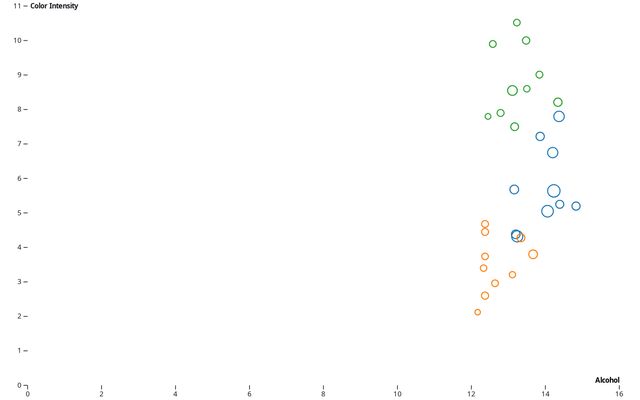
Brushable scatterplot
This notebook is a fork
cse-d3-assignment
Apr 3
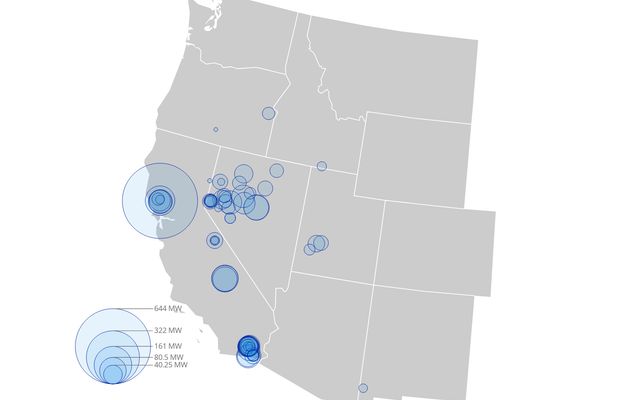
Proportional Symbol Mapping
This notebook is a fork
workspace
Apr 3
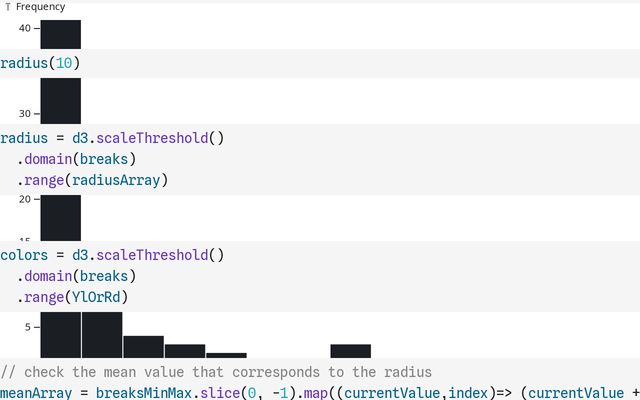
Graduated Symbol Mapping
This notebook is a fork
geoviz2026
Apr 3
Free return
Paul Carleton
Apr 3
til20260403
til
Apr 3
A Pattern Language – Summary
Martien van Steenbergen
Apr 3
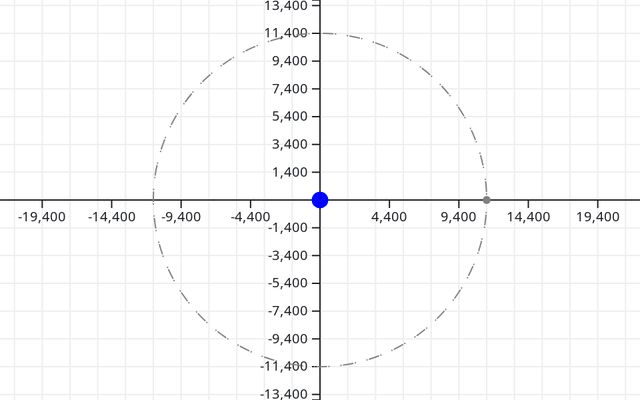
La carte de France
juliensgrt
Apr 3
GDP Over Time — Adapting a D3 Multi-Line Chart to World Bank Data
asu
Apr 4
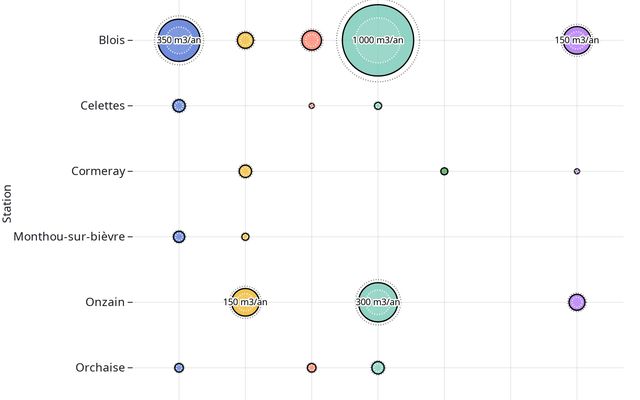
Bubbles VS Batonnets
Igmar's Workspace
Apr 3
Visualizations for Military expenditure dataset (1949 - 2024)
DataVisualisatie
Apr 3
•
1
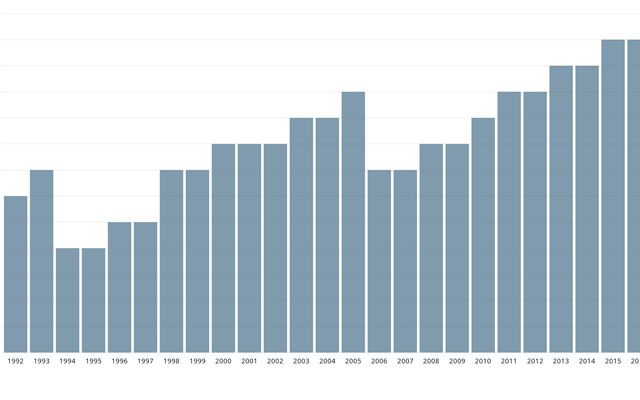
DVS Mentorship Week 3 - 3. Fix the Bar Chart
This notebook is a fork
Ana
Apr 3
Learning Vis Tools Tutorial 8: Visualization with D3.js
This notebook is a fork
visualization
Apr 5
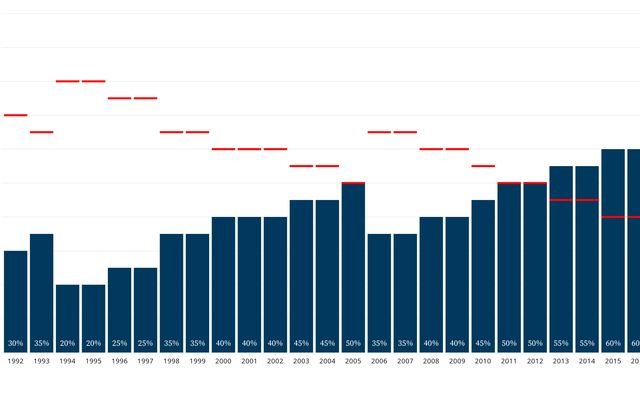
DVS Mentorship Week 3 - 2. Bar Chart markers
This notebook is a fork
Ana
Apr 3
•
1
D3 Visualization to New Data
Aayush's Workspace
Apr 4
Showing
31-60
of
10,000
notebooks
Prev
Next