Platform
Resources
Pricing
Sign in
Get started
Trending
Recent
Most stars last month
Most stars all time
Recent
Showing
1-30
of
10,000
notebooks
Prev
Next
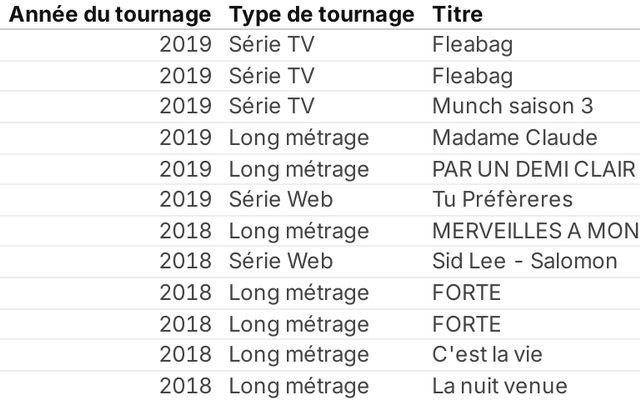
Visualisation des lieux de tournage à Paris
personal
Apr 6
Bar Chart Race
This notebook is a fork
cse478-03.25.26
Apr 6
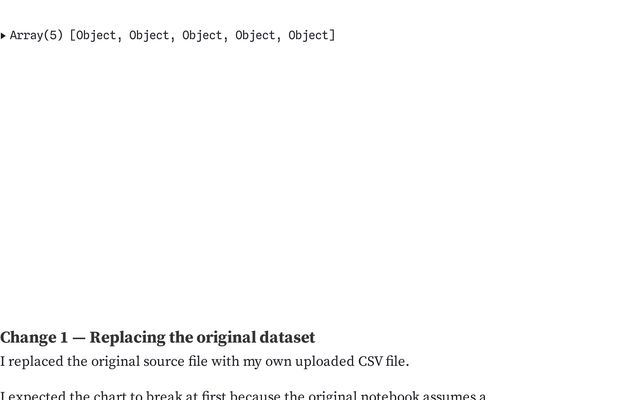
Shan Sma - Adapting a D3 Visualization to New Data
Spring 2026 - CSE 478
Apr 6
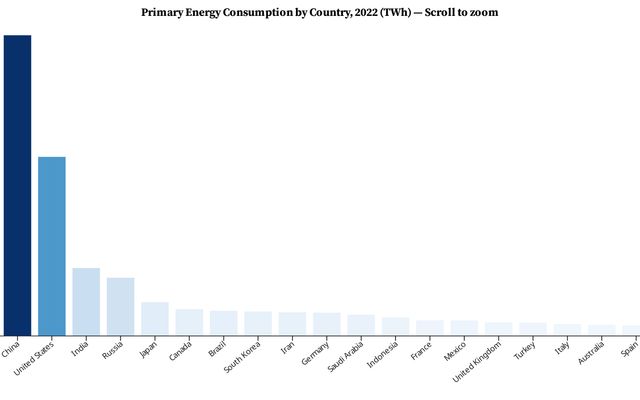
Zoomable bar chart
This notebook is a fork
CSE478 Activity 3.25.26 RW
Apr 6
Adapting a D3 Visualization to New Data
asu
Apr 6
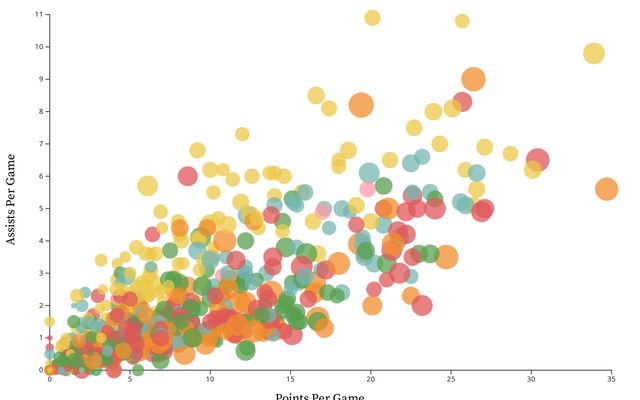
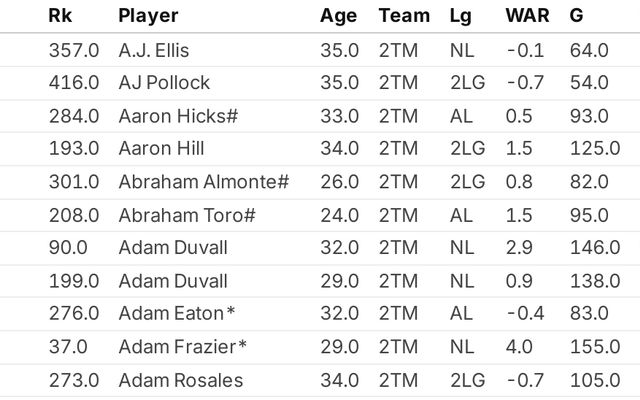
MLB Batting Data Analysis
Kh4552's workspace
Apr 5
Section 1 - Orginal Visualization
478
Apr 5
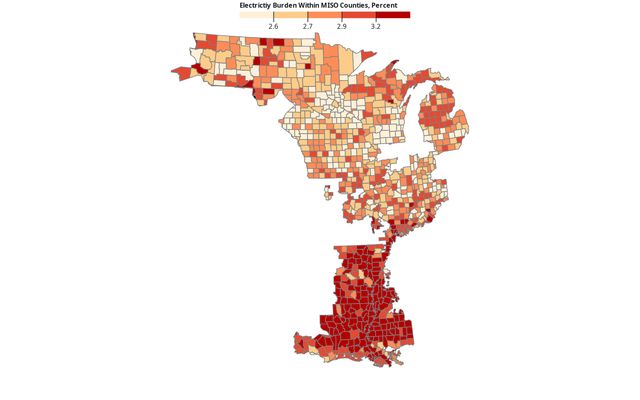
Electricity Burden Within MISO Counties, Percent
This notebook is a fork
GeoViz
Apr 5
Section 1:
ASU
Apr 5
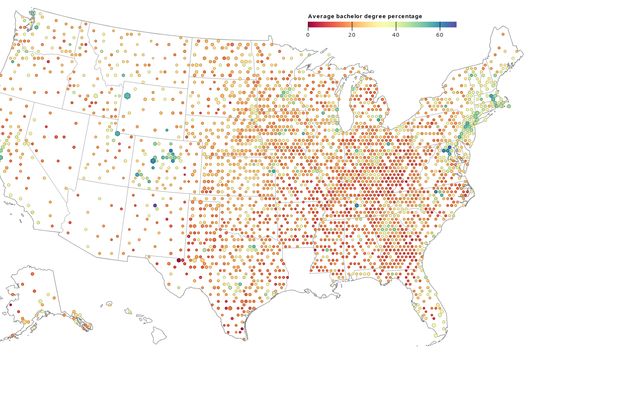
Adapting a D3 Visualization to New Data
school
Apr 5
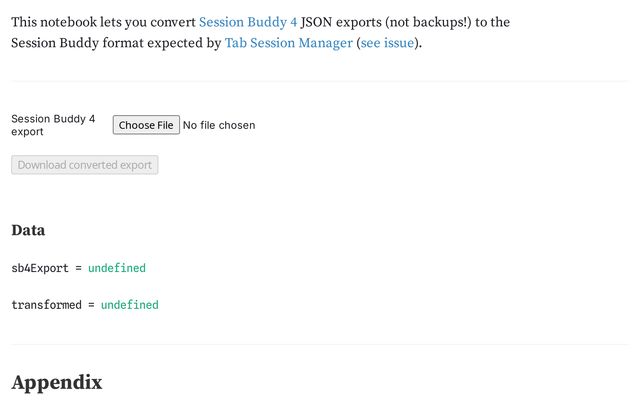
Session Buddy 4 to Tab Session Manager
This notebook is a fork
salticidae's
Apr 5
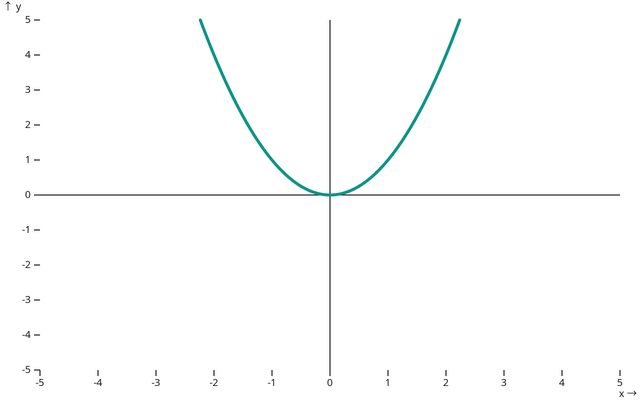
Power Functions
School
Apr 5
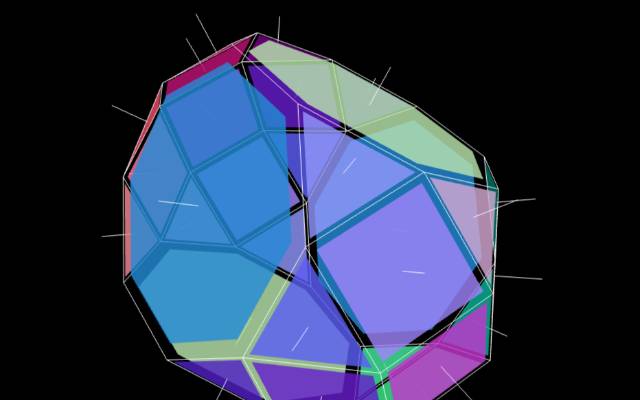
Hello, polyhedra!
Fabian Iwand
Apr 5
Dhurandhar
Arizona State University
Apr 5
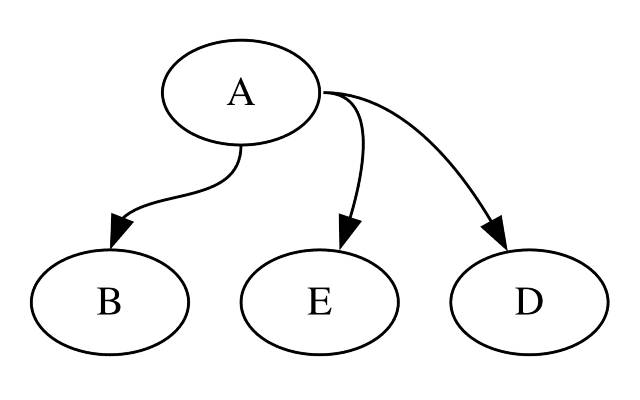
Hello, viz.js!
Fabian Iwand
Apr 5
•
2
SolidJS Examples
Fabian Iwand
Apr 5
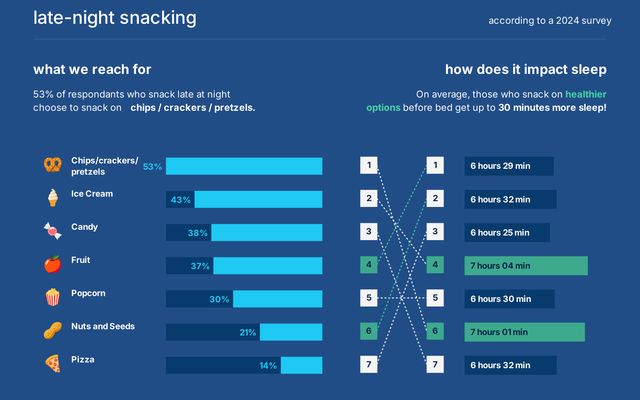
Late-night Snacking
fyp
Apr 5
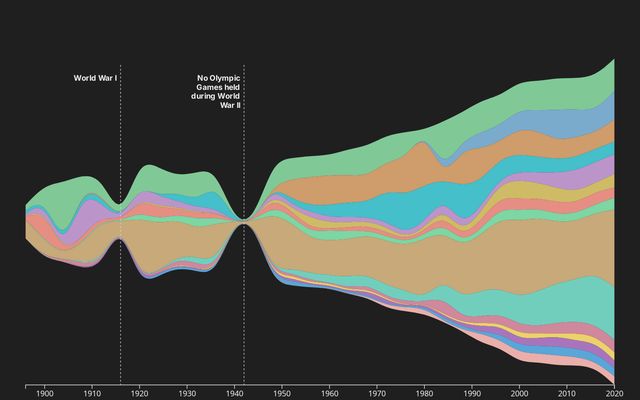
Olympic Games Medals over Time
fyp
Apr 5
Assignment 2 by S M Mazharul Hoque Chowdhury
University of North Texas
Apr 5
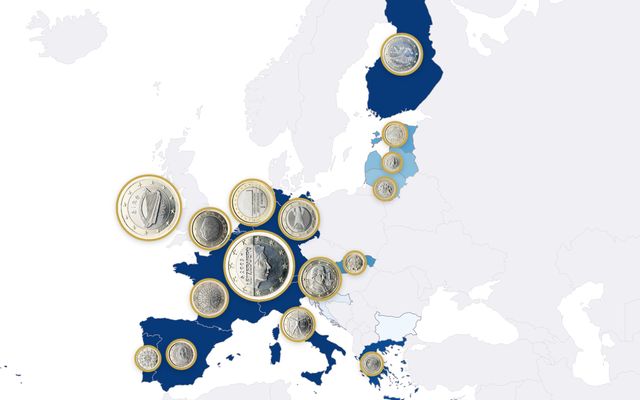
Pays de la Zone Euro
Valentin Brajon
Apr 5
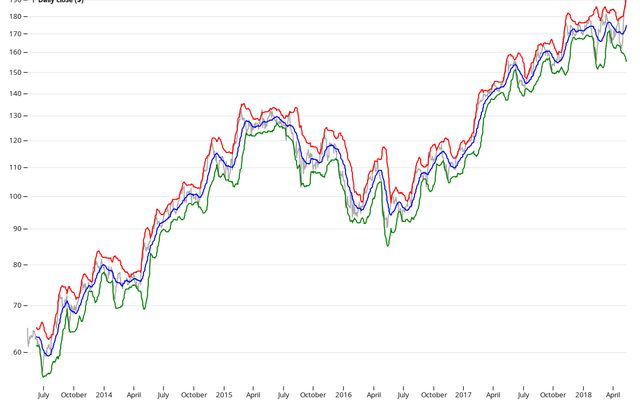
Bollinger bands
This notebook is a fork
Arizona State University
Apr 5
Walmart’s growth
This notebook is a fork
ASU
Apr 5
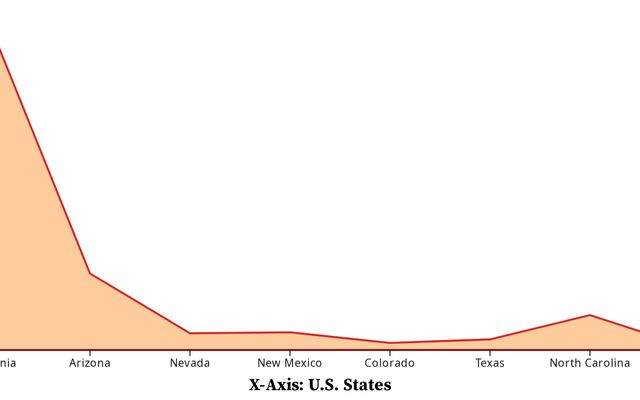
Area Chart
data vis
Apr 5
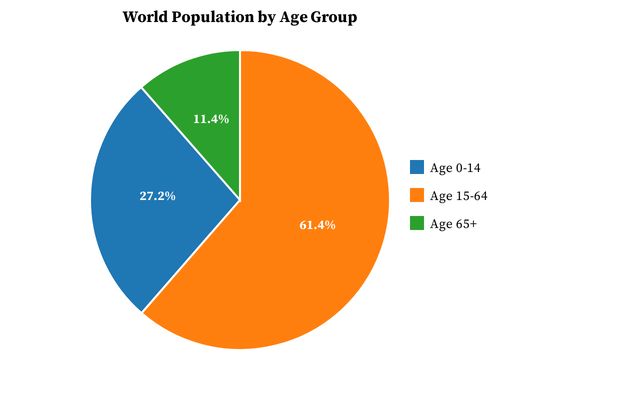
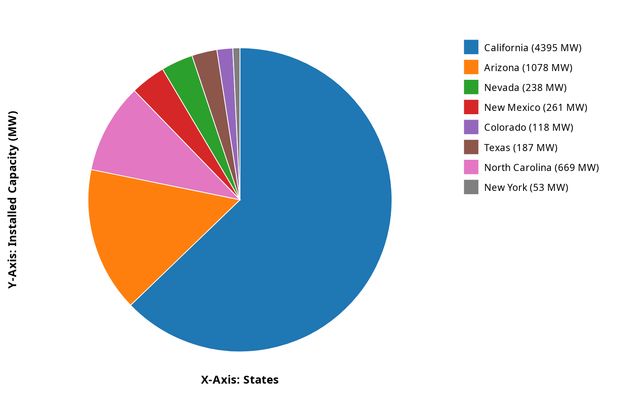
Pie chart
data vis
Apr 5
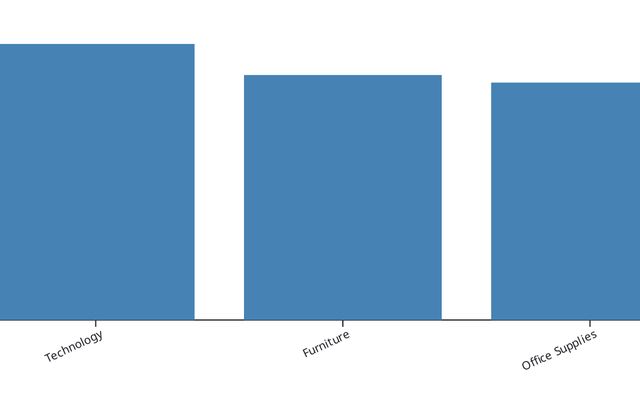
Section 1 — Original Visualization
Arizona State University
Apr 5
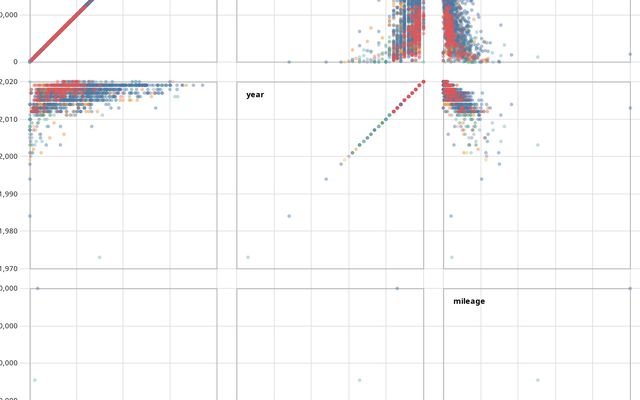
Brushable scatterplot matrix
This notebook is a fork
Layton
Apr 6
Oceanus Folk influence spread — interactive analysis
Data Visualisation
Apr 4
Story timeline Visualization v1 (Inception): no alignment
This notebook is a fork
University of Waterloo
Apr 5
Adapting a D3 Visualization to New Data Assignment
Arizona State University
Apr 6
Milestone 1
ASU
Apr 4
Showing
1-30
of
10,000
notebooks
Prev
Next