Notebooks
Resources
Pricing
Sign in
Get started
Trending
Recent
Most stars last month
Most stars all time
Recent
Showing
1,771-1,800
of
10,000
notebooks
Prev
Next
Objectifs
Riate
May 12
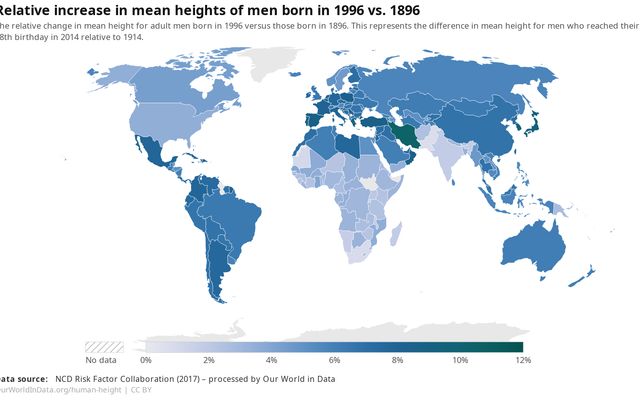
Relative increase in mean height
Data FYP
May 12
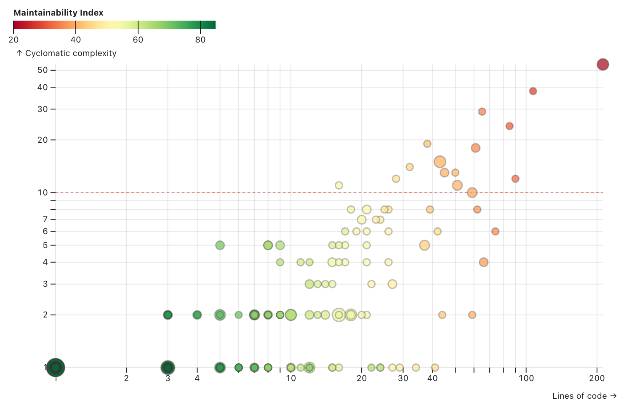
Code Metrics
Tom Larkworthy
May 12
•
5
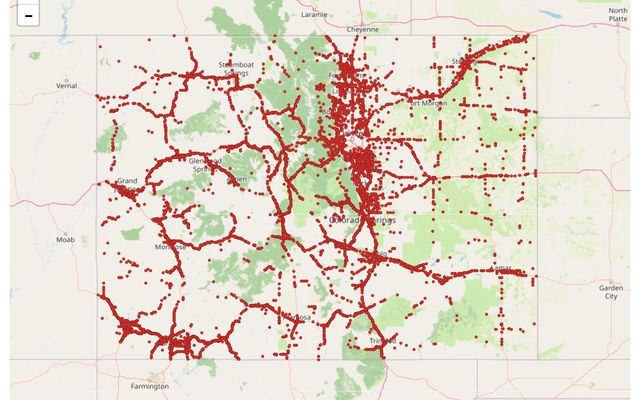
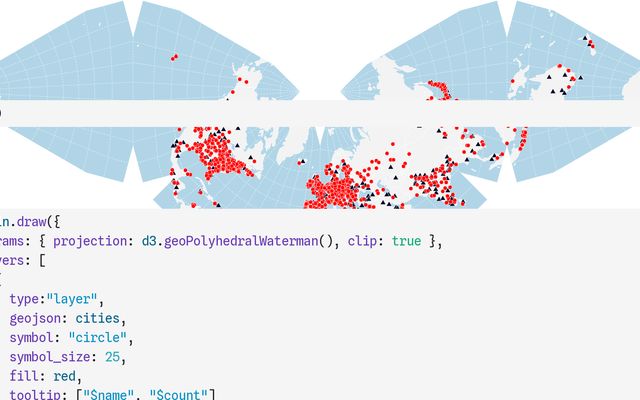
Interactive Dot Mapping on the Web
Akinwale
May 12
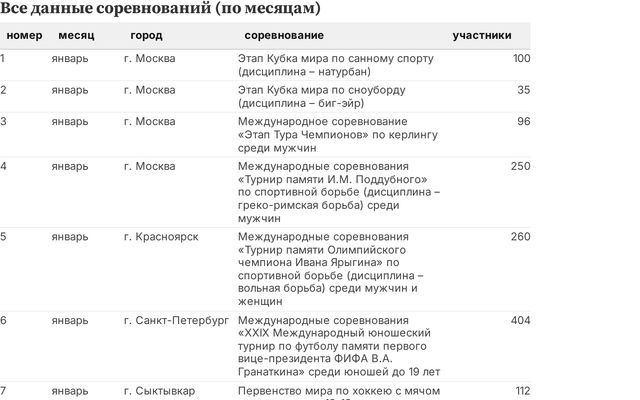
Обзор и анализ международных спортивных событий в России в 2017 году
StandAround
May 12
Walking the Health Divide: King County
Jesse Yu's workspace
May 12
CSE512-A3
This notebook is a fork
Arpa
May 12
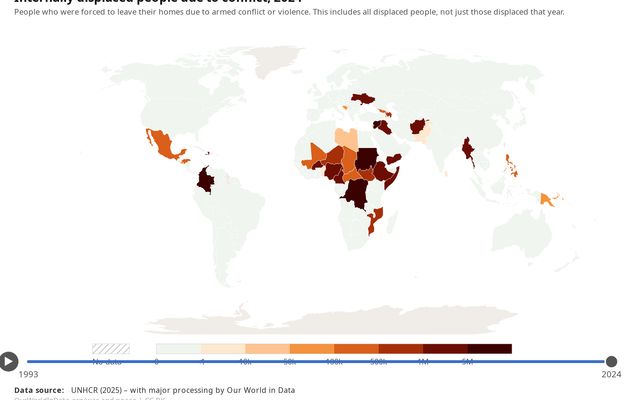
Internally displaced people due to conflict
Data FYP
May 12
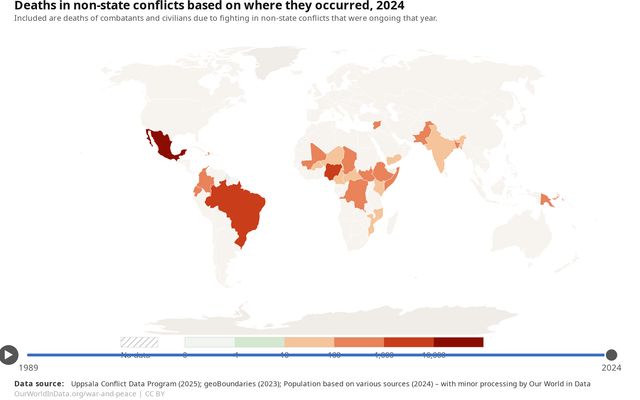
Deaths in non-state conflicts 2024
Data FYP
May 12
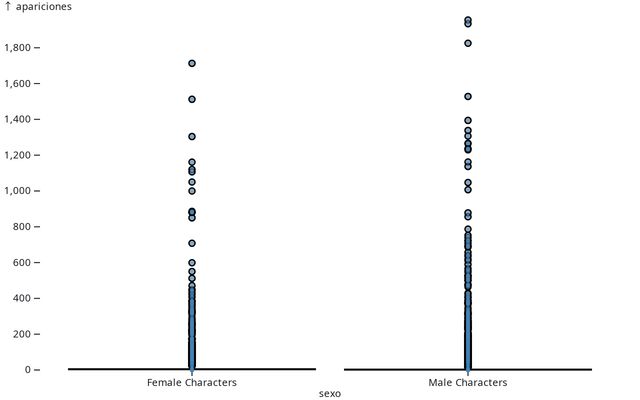
Representación de personajes femeninos en los cómics de MARVEL (1939-2013)
This notebook is a fork
tec
May 11
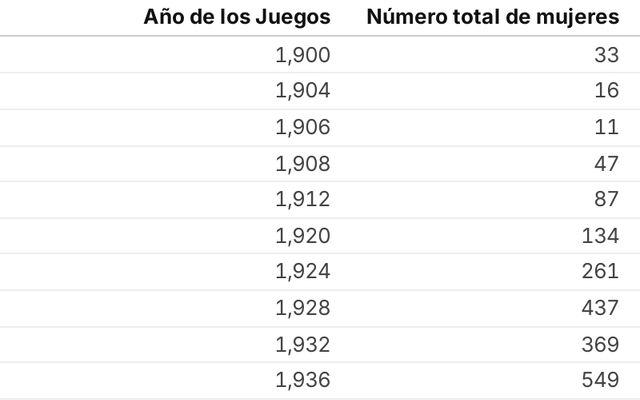
Análisis juegos olímpicos
This notebook is a fork
TEC
May 11
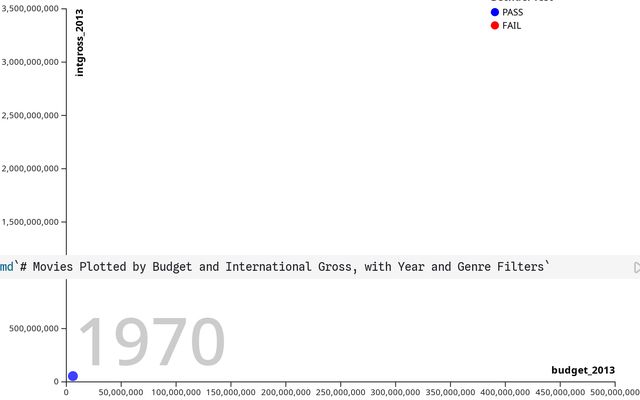
New Graph with Genre Filter
This notebook is a fork
Workspace
May 11
Representación de personajes femeninos en los cómics de MARVEL (1939-2013)
This notebook is a fork
Tecnologico de Monterrey
May 11
Representación de personajes femeninos en los cómics de MARVEL (1939-2013)
This notebook is a fork
Tec de Monterrey
May 11
RQ2 data and map
This notebook is a fork
SPARKrew
May 11
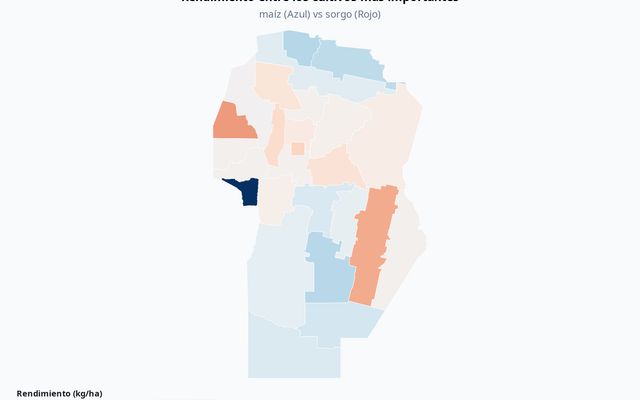
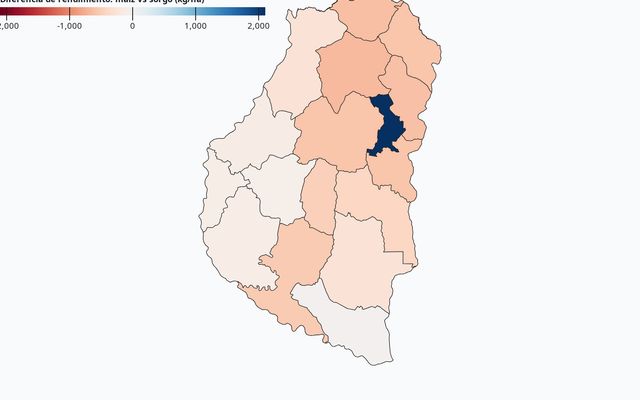
Actividad 4: Mapas y Eventos
This notebook is a fork
Tomás San Miguel
May 11
Representación de personajes femeninos en los cómics de MARVEL (1939-2013)
tec
May 11
Landingpage
Tolga Kus
May 11
Actividad 4: Mapas y Eventos
This notebook is a fork
Luagiusto
May 11
Análisis del fenotipo del atleta olímpico ideal por disciplina a través de los…
Tecnológico de Monterrey
May 11
Build a simple interactive Gantt chart
This notebook is a fork
Maggie Larson
May 13
Function Machine
IVAN LYLOV
May 11
Actividad 4: Mapas y Eventos
This notebook is a fork
Javier Astorga
May 11
Actividad 4: Mapas y Eventos
This notebook is a fork
Agustin Besada
May 11
Actividad 4: Mapas y Eventos
This notebook is a fork
Samuel Sedran
May 11
Actividad 4: Mapas y Eventos
This notebook is a fork
Pedro Labate
May 11
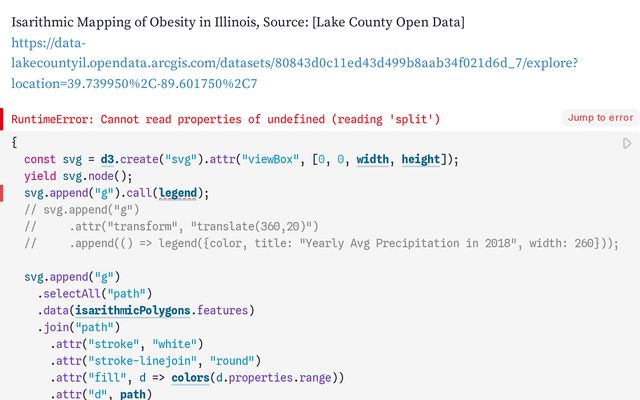
Isarithmic Mapping: GEOG 3540
This notebook is a fork
npkrishnan
May 11
Actividad 4: Mapas y Eventos
This notebook is a fork
Candelaria Zangari
May 11
Actividad 4: Mapas y Eventos
This notebook is a fork
Violeta Waisman
May 11
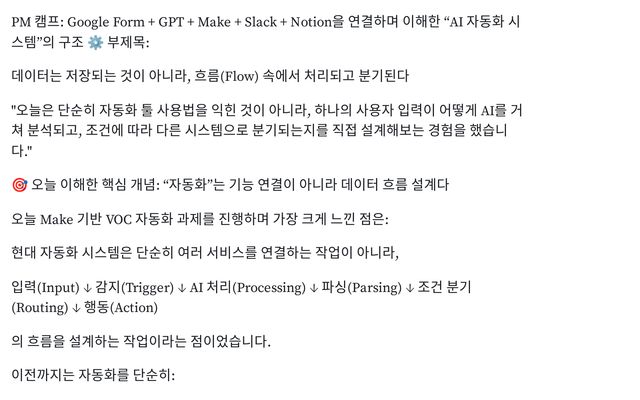
🛠️ [TIL] Make 기반 AI 자동화 워크플로우 구축 실습
til
May 11
Showing
1,771-1,800
of
10,000
notebooks
Prev
Next