Notebooks
Resources
Pricing
Sign in
Get started
Trending
Recent
Most stars last month
Most stars all time
Recent
Showing
2,341-2,370
of
10,000
notebooks
Prev
Next
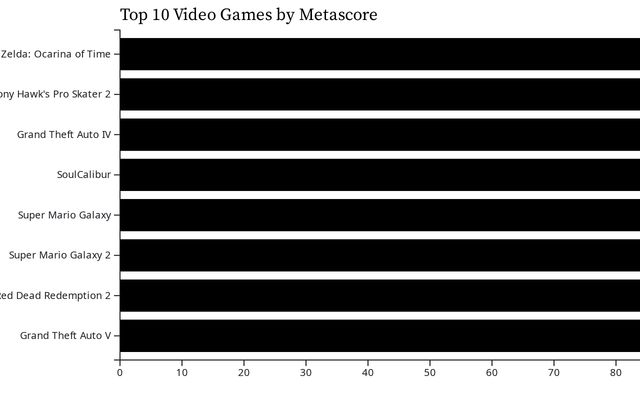
HW1: Static Visualizations - Best Video Games
Omar Odeh
Apr 29
Homework 1
Liam McCoy
Apr 29
VISUALIZACIONES CON DISTINTAS HERRAMIENTAS
Sandraga
Apr 29
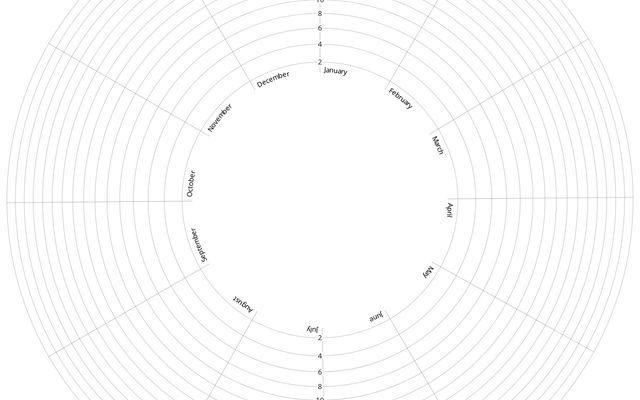
Radial area chart
This notebook is a fork
AA
Apr 29
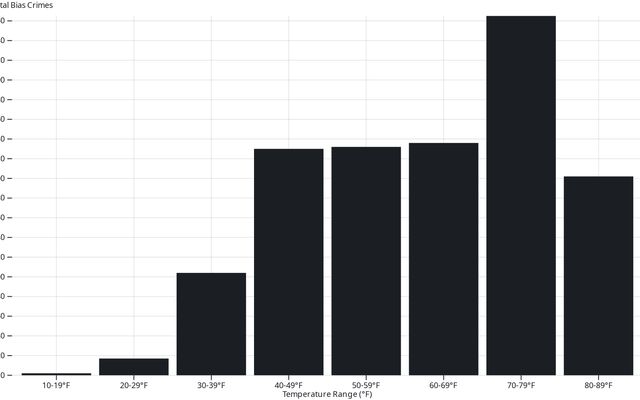
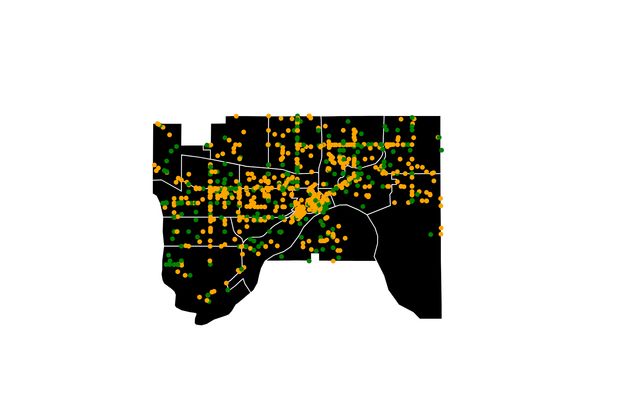
Thermal Urbanism in Washington D.C.
Mohamed Benmansour
Apr 30
Invisible Until Invited: BNGAP 2026, NYC
This notebook is a fork
BNGAP 2026
Apr 29
Invisible Until Invited: BNGAP 2026, NYC
BNGAP 2026
Apr 29
•
1
Final Project Notebook
This notebook is a fork
GVSU Data Vis
Apr 29
Generative Prototype
Maria's Workspace - DataViz @ ID
Apr 29
•
1
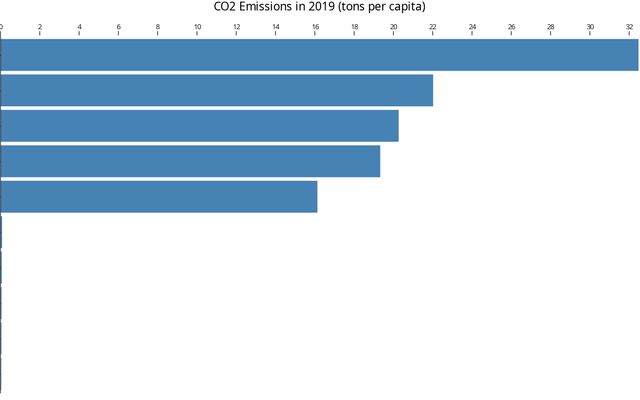
CO2 Emissions Visualizations
Ria Bhandari
Apr 29
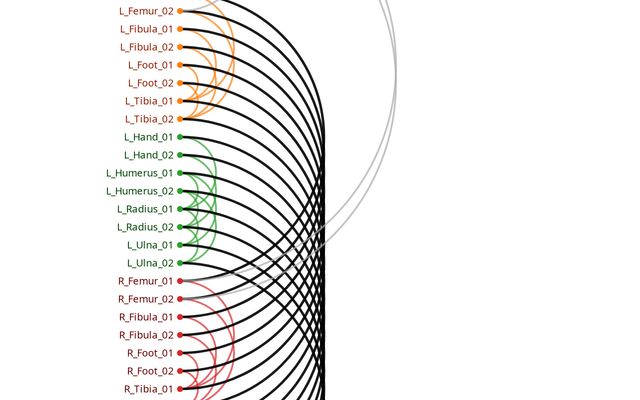
Arc diagram
This notebook is a fork
reuben
Apr 30
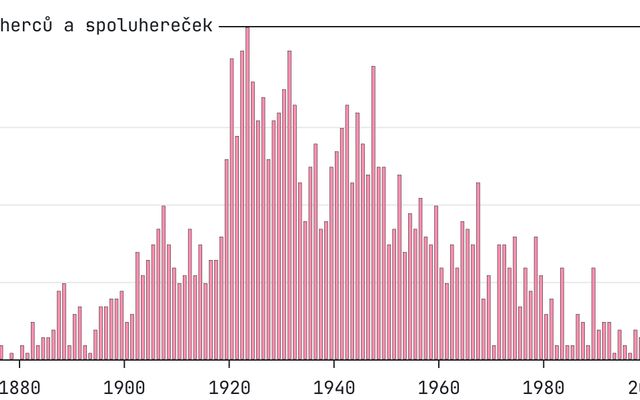
Column chart s anotacemi
Smzd
Apr 29
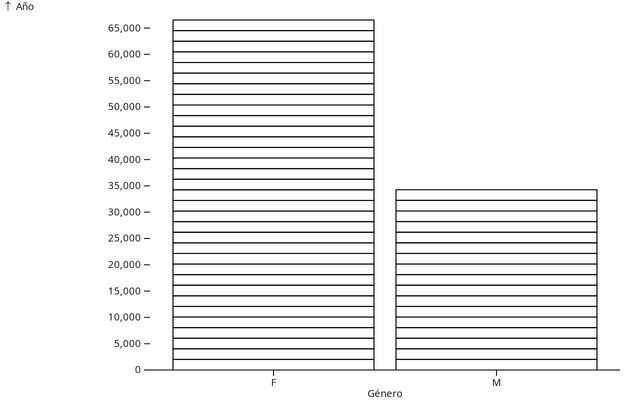
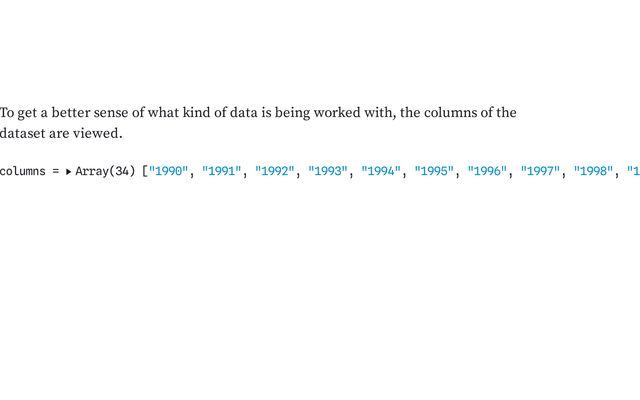
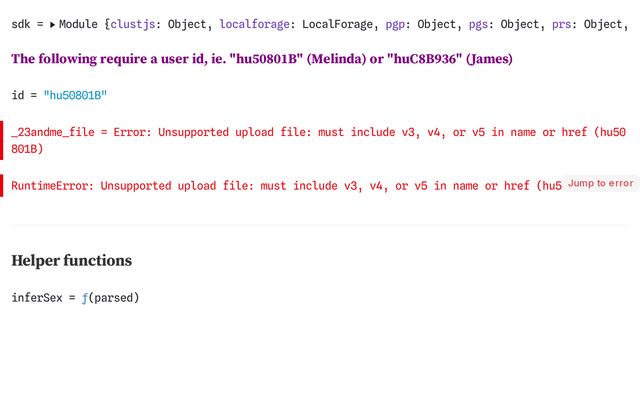
How to Infer Sex from 23andMe Files
lorenasandoval88
Apr 29
Projeto_careca_ii
Eric Careca
Apr 29
Adventures in D3: Accessibility - Starter Code
notebook8
Apr 29
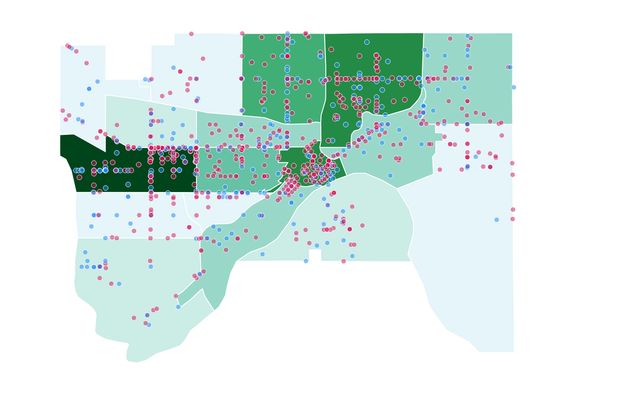
Choropleth
This notebook is a fork
DS2010
Apr 29
Introduction to D3, Part 2 (Starter)
This notebook is a fork
Ameya Patil
Apr 30
Adventures in D3: Accessibility - Starter Code
tpoc19
Apr 29
ObservableHQ - Chart1
This notebook is a fork
UNCC
Apr 29
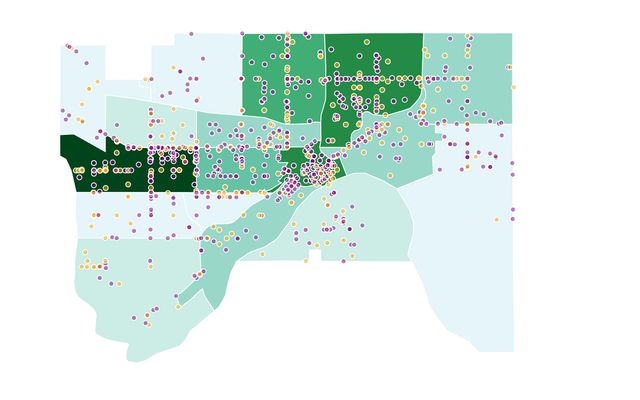
Adventures in D3: Maps
EklemmForks
Apr 29
Adventures in D3: Accessibility - Starter Code
Kirtan Patel
Apr 29
•
1
Adventures in D3: Maps
jonahsworkspace
Apr 29
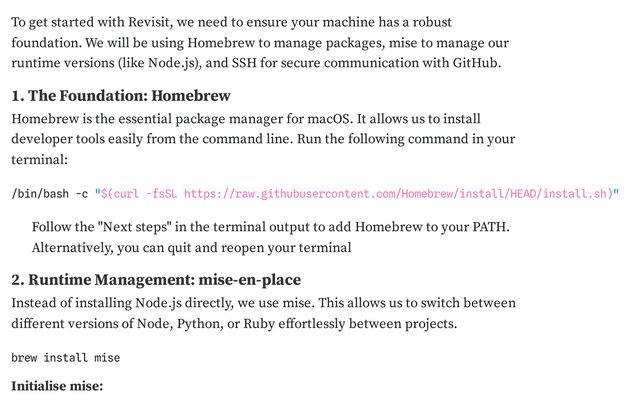
Local Development Setup: Revisit.dev
Chi
Apr 29
Airline Customer Satisfaction Dashboard
This notebook is a fork
DSBA-5122-charts
Apr 29
<!DOCTYPE html>
Cris0326
Apr 29
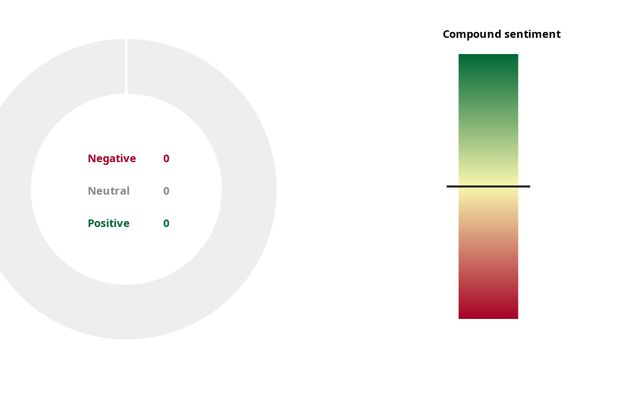
Vader Sentiment Playground
This notebook is a fork
Louisiana State University
Apr 29
Adventures in D3: Maps
notebook8
Apr 29
Presidencia de México (desde 1911 hasta 2024)
MV
Apr 29
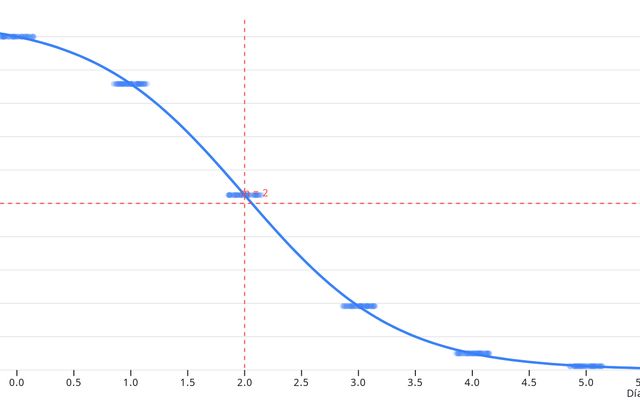
SLA Pro v3 — Modelo Bayesiano de Cumplimiento
Skydropx
Apr 29
Video Game Sales Dashboard
This notebook is a fork
UNCC
Apr 29
Showing
2,341-2,370
of
10,000
notebooks
Prev
Next