Platform
Resources
Pricing
Sign in
Get started
Trending
Recent
Most stars last month
Most stars all time
Recent
Showing
241-270
of
10,000
notebooks
Prev
Next
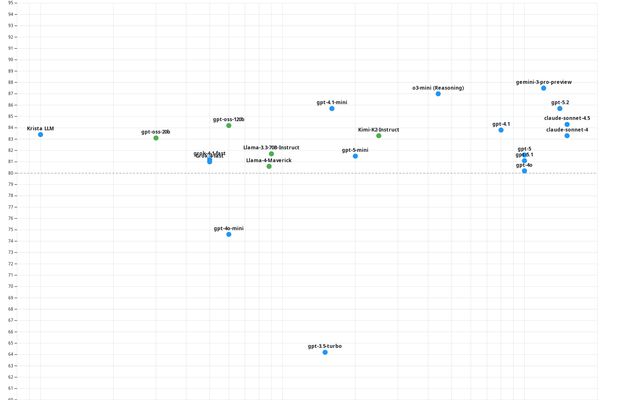
Evaluating LLM Cost on Basis of Price of Performance
Kallol Chatterjee
Mar 31
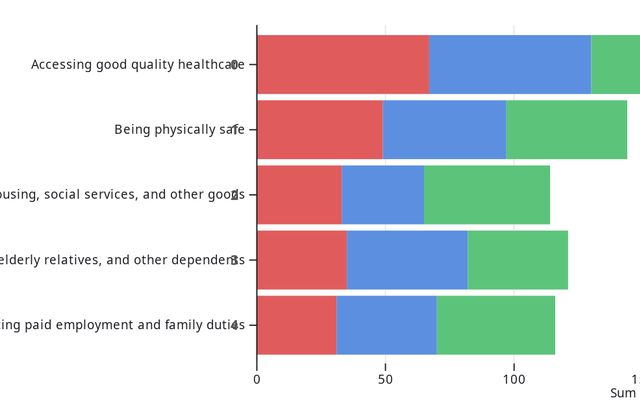
PIP-XAI Visualisations - Shared
Leeds Institute of Data Analytics (LIDA)
Mar 31
•
1
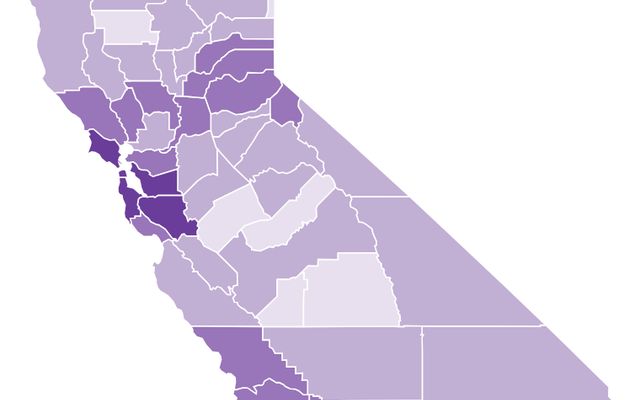
Geography of Educational Attainment in California
Prueba
Mar 31
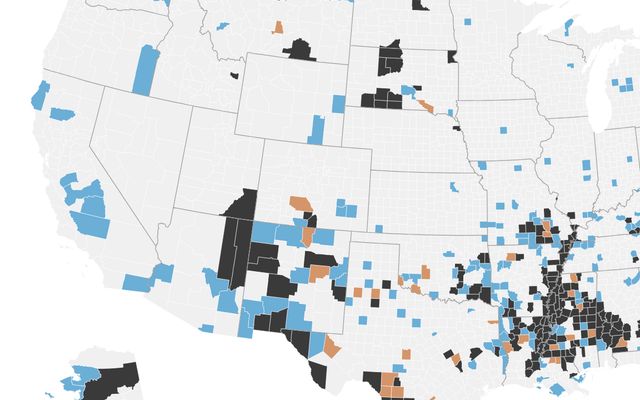
Persistent poverty and high poverty U.S. counties
Prueba
Mar 31
Візуалізація
Study
Mar 31
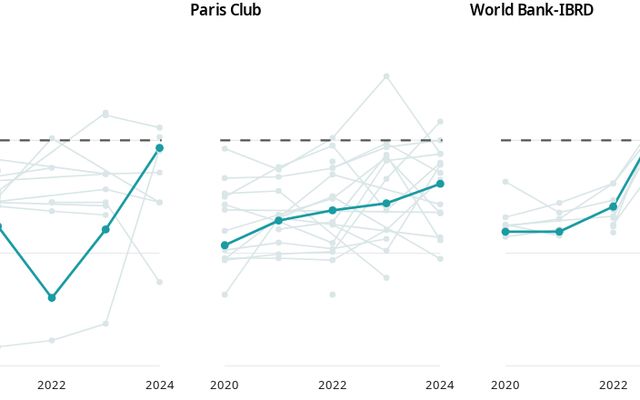
Expected payments per $100 borrowed
ONE Campaign
Mar 31
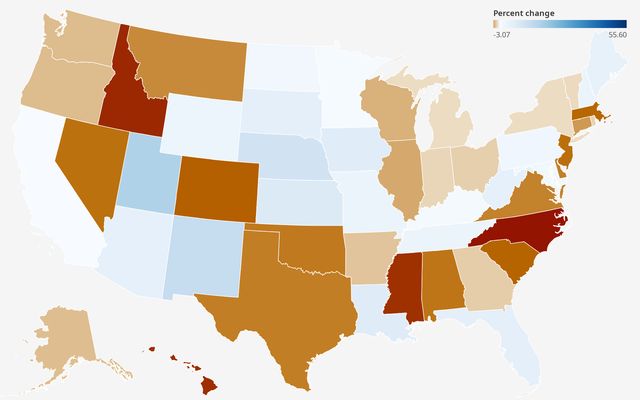
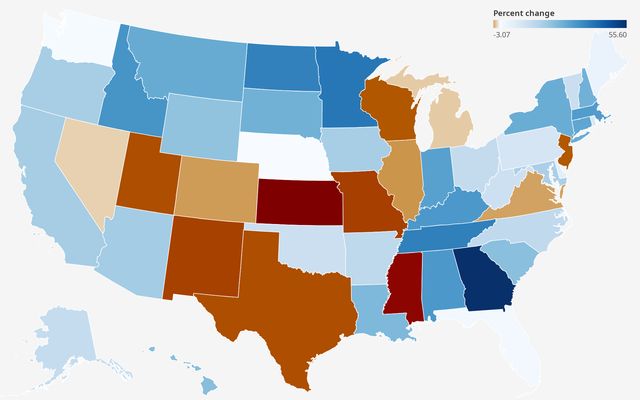
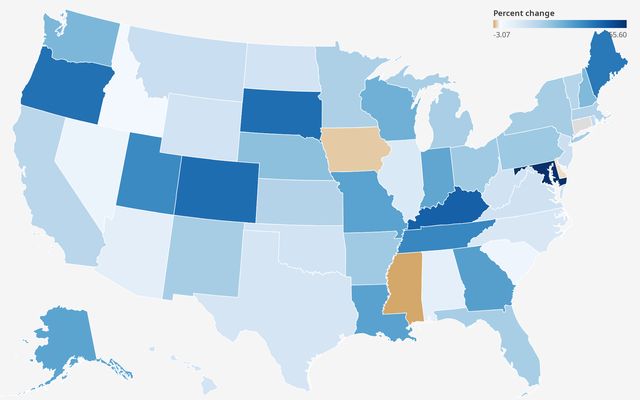
Percent Change in Past Month Alcohol Use between 2011 and 2016 by State
Prueba
Mar 31
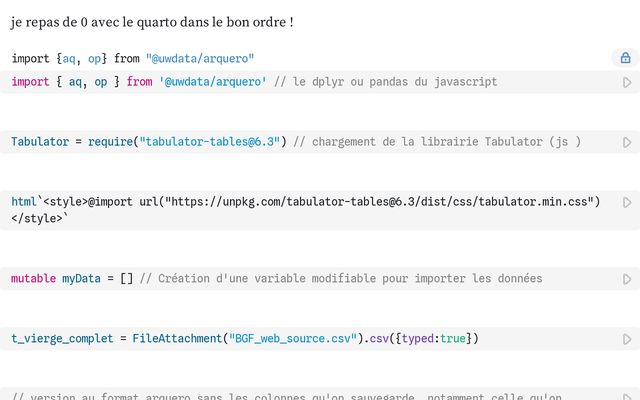
BGF sauvegarde light
Igmar's Workspace
Mar 31
Ranking Dataset
UNTWIST
Mar 31
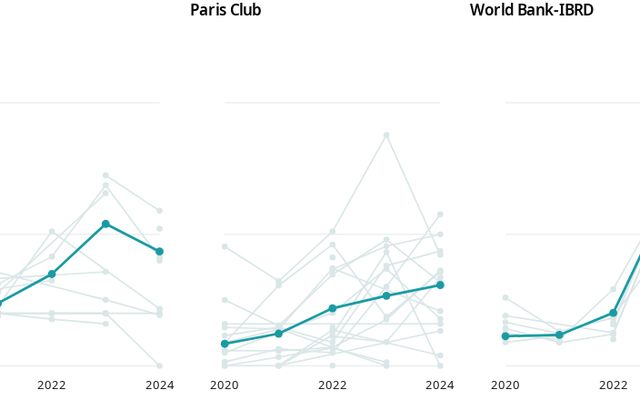
Weighted Average interest rates by borrowing group
This notebook is a fork
ONE Campaign
Mar 31
How I use Observable
This notebook is a fork
Andrew Witherspoon
Apr 2
Learning Vis Tools Tutorial 7: Vega-Lite and data processing libraries
This notebook is a fork
王琮睿
Mar 31
Estimate Economic Returns on Adaptation
This notebook is a fork
Bako Natioanl Maize Research Center
Mar 31
Estimate Economic Returns on Adaptation
This notebook is a fork
Bako Natioanl Maize Research Center
Apr 2
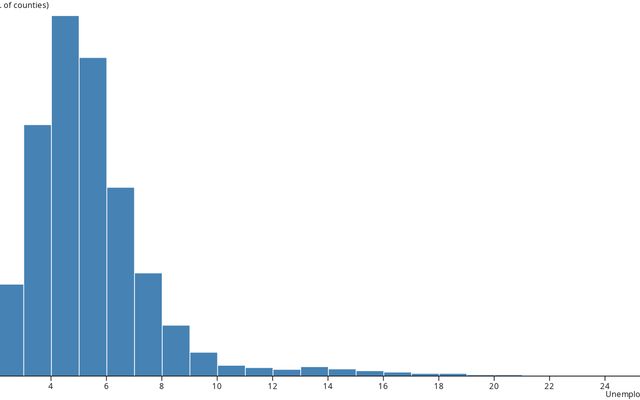
Histogram
This notebook is a fork
Aayush's Workspace
Mar 31
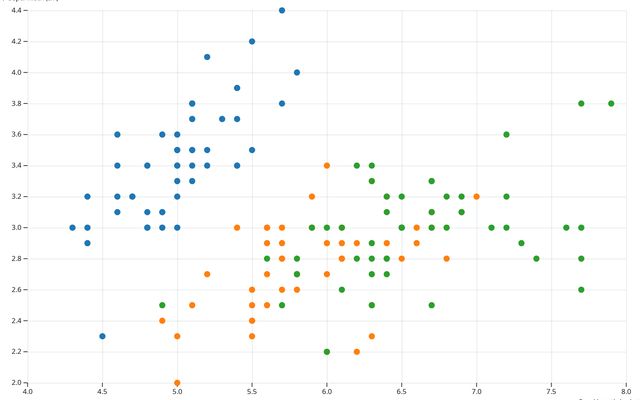
Scatterplot with shapes
This notebook is a fork
Aayush's Workspace
Mar 31
Adapting a D3 Visualization to New Data
This notebook is a fork
vkakadiy
Mar 31
Explore the Datasets
This notebook is a fork
Kiyafenu
Mar 31
Explore the Datasets
This notebook is a fork
Kiyafenu
Mar 31
Line chart
This notebook is a fork
Aayush's Workspace
Mar 31
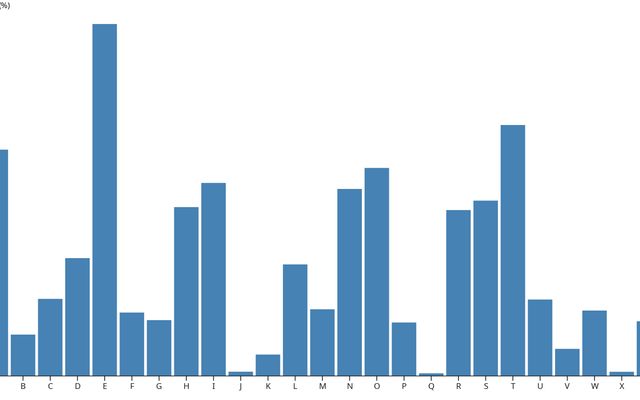
Bar chart
This notebook is a fork
Aayush's Workspace
Mar 31
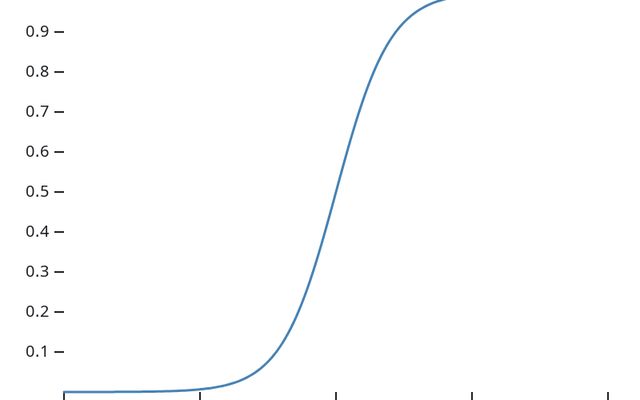
Sigmoid Function
Bhargav Kowshik
Mar 31
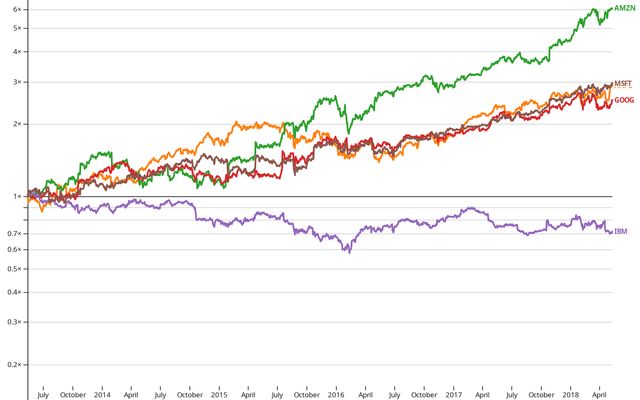
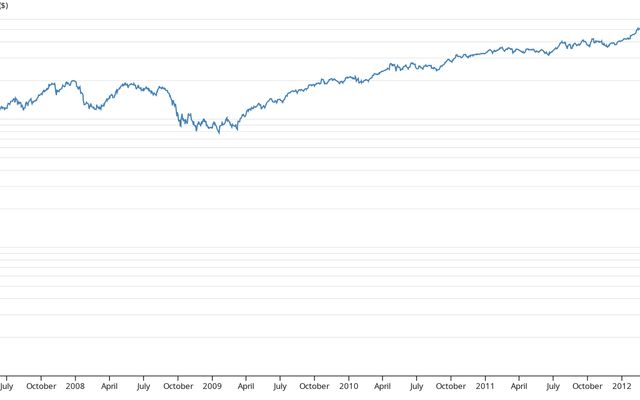
Index chart
This notebook is a fork
Rohan Byrapuneni
Mar 31
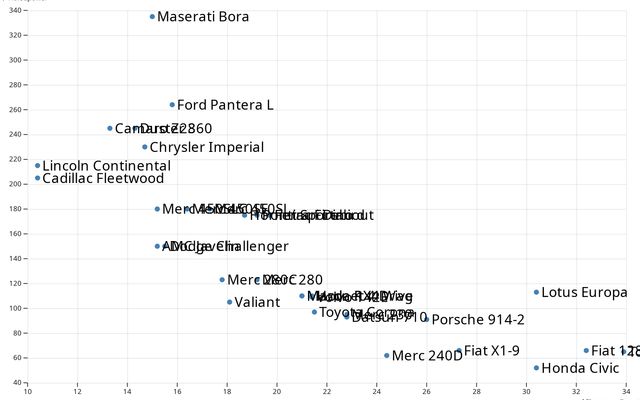
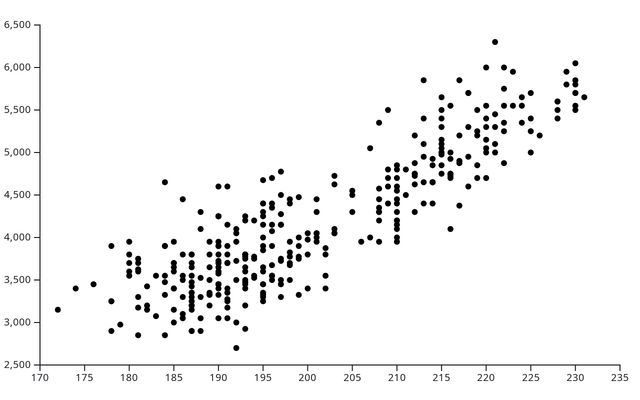
Scatterplot
This notebook is a fork
Rohan Byrapuneni
Mar 31
Percent Change in Past Year Cocaine Use 2011 -2016 by state
Prueba
Mar 31
Line chart
This notebook is a fork
Rohan Byrapuneni
Mar 31
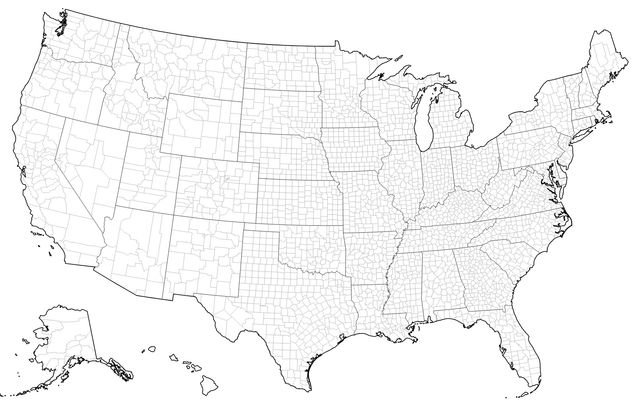
D3 U.S. map
This notebook is a fork
vkakadiy
Mar 31
D3 scatterplot
This notebook is a fork
vkakadiy
Mar 31
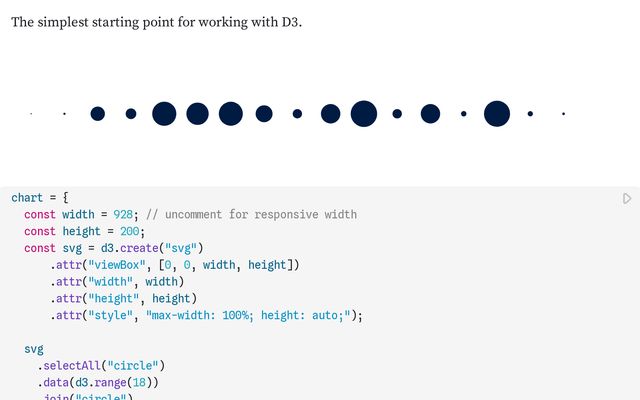
Simple D3
This notebook is a fork
vkakadiy
Mar 31
Percent Change in Marijuana Use 2011 to 2016 by State
Prueba
Mar 31
Showing
241-270
of
10,000
notebooks
Prev
Next