Platform
Resources
Pricing
Sign in
Get started
Trending
Recent
Most stars last month
Most stars all time
Recent
Showing
541-570
of
10,000
notebooks
Prev
Next
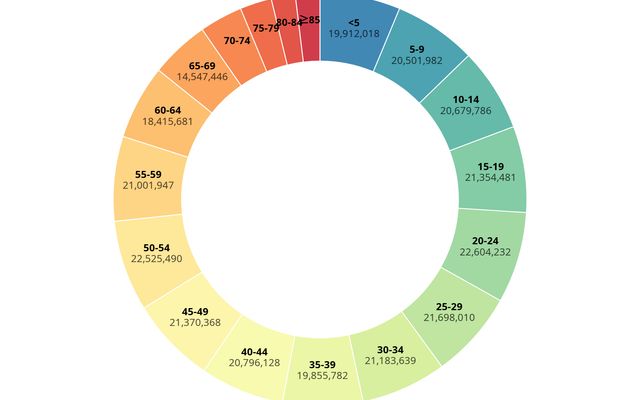
Donut chart
This notebook is a fork
YannGuiz
Mar 25
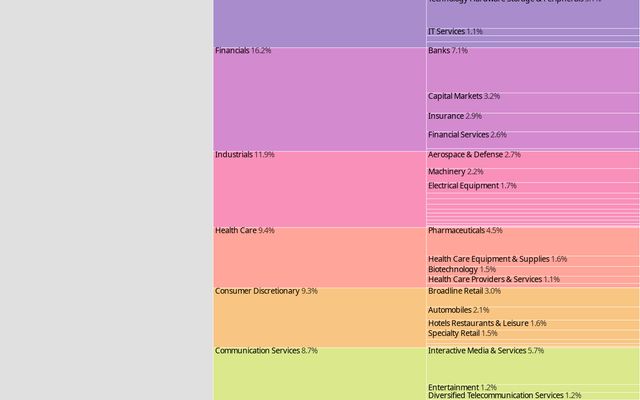
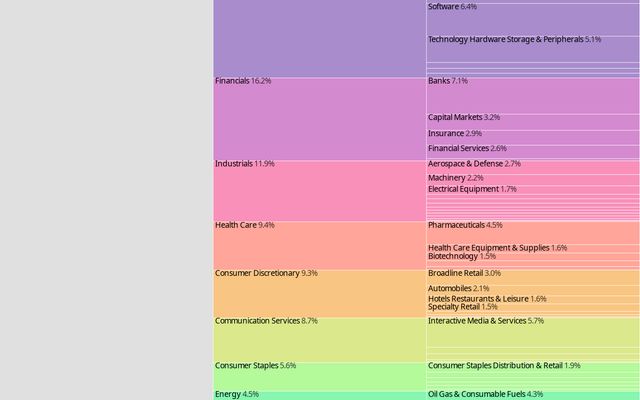
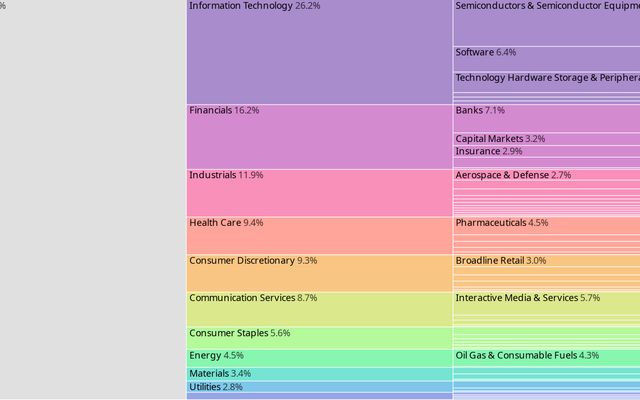
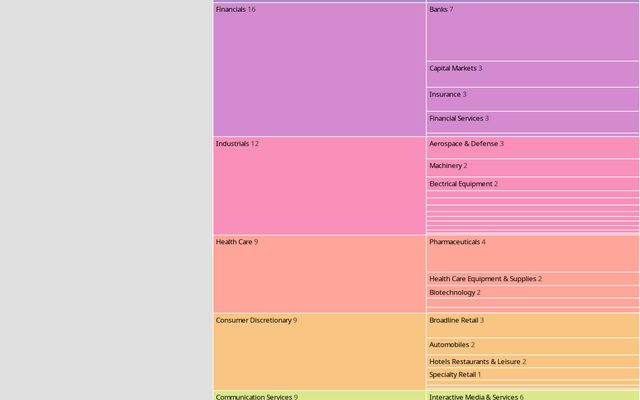
MSCI World Breakdown
This notebook is a fork
Erin Ramey
Mar 24
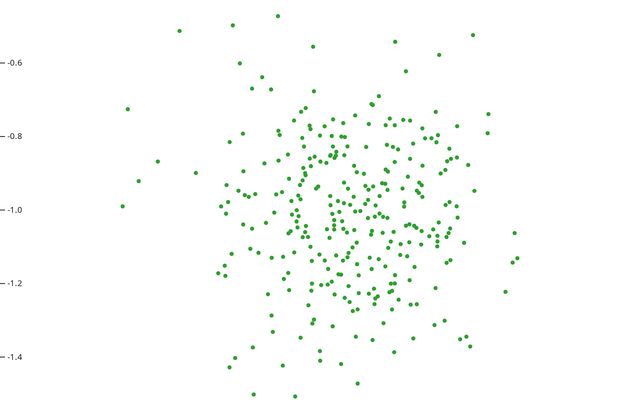
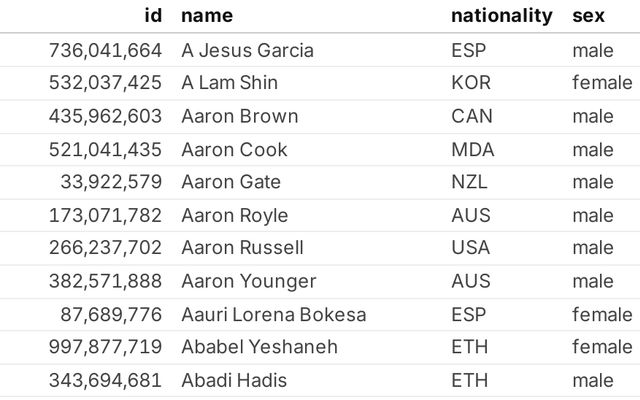
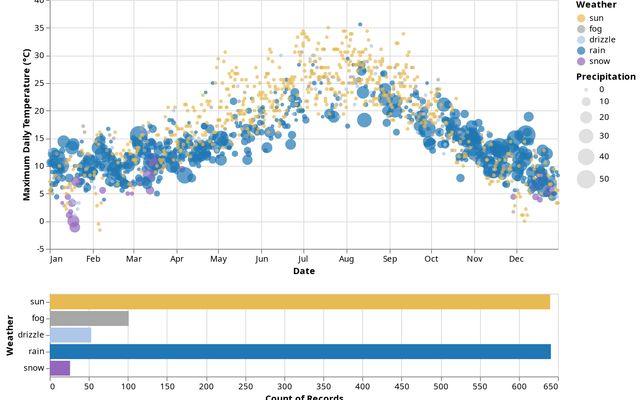
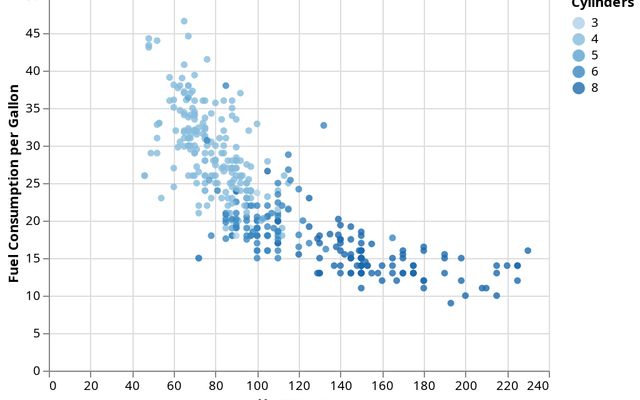
Scatterplot tour
This notebook is a fork
YannGuiz
Mar 25
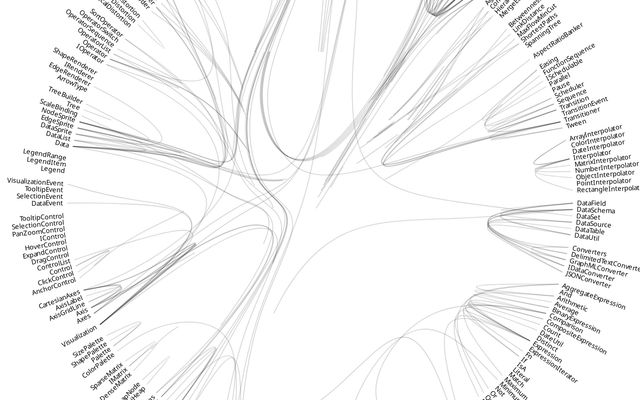
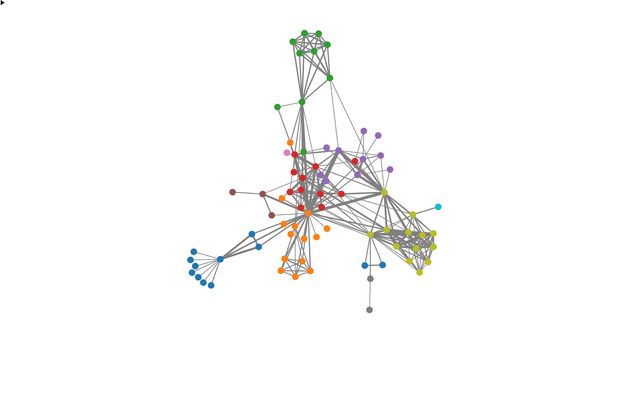
Hierarchical edge bundling
This notebook is a fork
YannGuiz
Mar 25
Lecture 13 - (24/03/26)
data-viz
Mar 24
MSCI World Breakdown
This notebook is a fork
Erin Ramey
Mar 24
•
1
Campus Mood Tracker
mood tracker
Mar 24
Plot: Image beeswarm
This notebook is a fork
KEM Data Repos
Mar 24
MSCI World Breakdown
This notebook is a fork
Erin Ramey
Mar 24
•
1
Zoomable icicle
This notebook is a fork
Erin Ramey
Mar 24
•
1
Clusters by Host Genus, Species, & Strain
WabushOnce
Mar 24
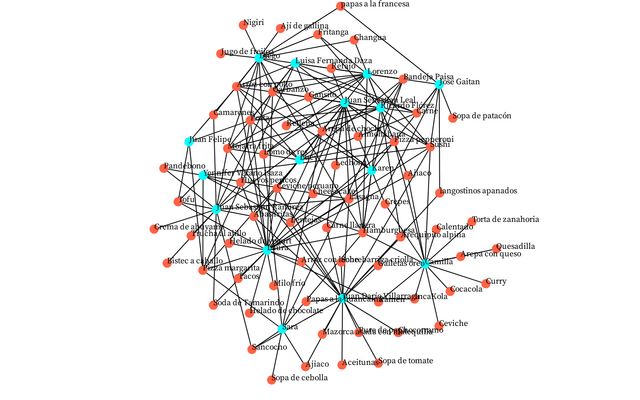
Visualización de red
Sergio Rodríguez Gómez
Mar 24
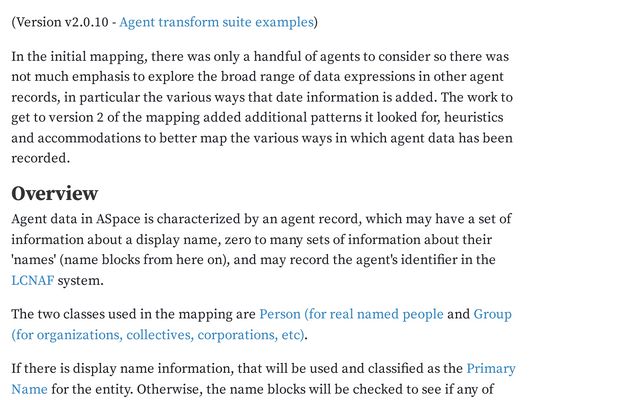
ArchivesSpace Agent mapping
getty
Mar 24
Learning Vis Tools Tutorial 6: Javascript basics and Observable
This notebook is a fork
Workspace
Mar 24
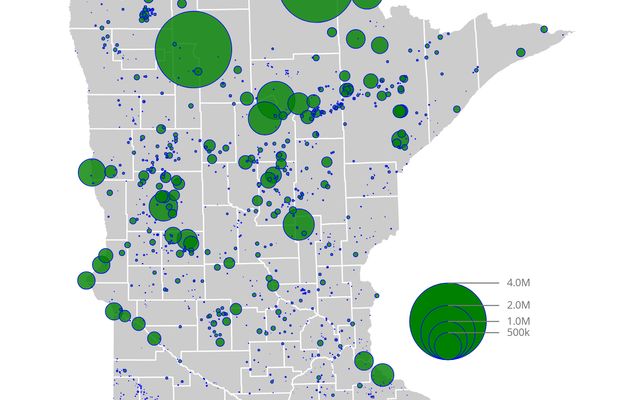
Proportional Symbol Mapping
This notebook is a fork
Caglar Koylu
Mar 24
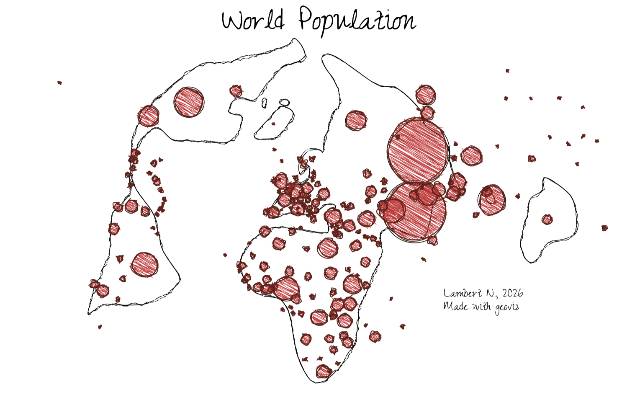
Sketch
Nicolas Lambert
Mar 24
Let's draw a sketch map
Nicolas Lambert
Mar 24
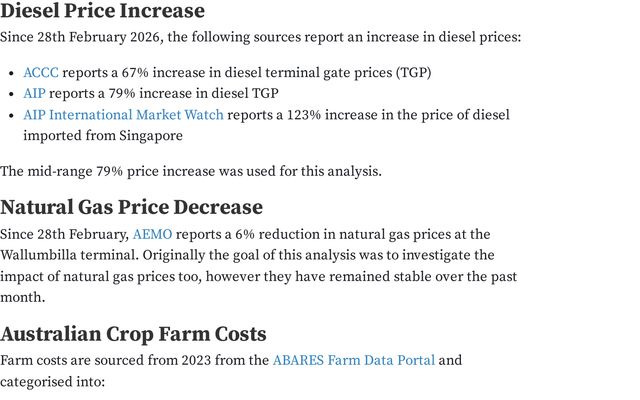
Impact of Diesel Prices on Australian Crop Farms
Vercidium
Mar 24
FIFA Goals
Sudev Kiyada's Workspace
Mar 24
Introduction to data wrangling and analysis in JavaScript - Session 4 Key
Tyler Randall - Data Visualization
Mar 24
Introduction to data wrangling and analysis in JavaScript — Session 1 Key
Tyler Randall - Data Visualization
Mar 24
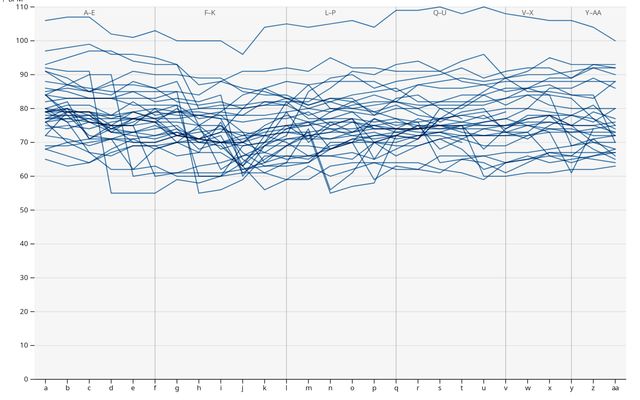
Line chart, multiple series
This notebook is a fork
joodymon
Mar 24
pi
Deepali Kank
Mar 24
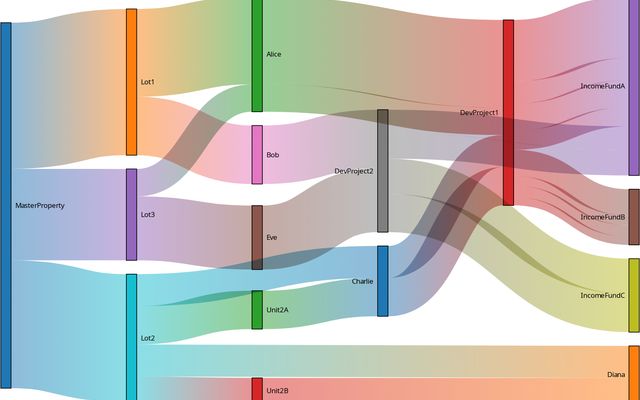
Sankey diagram
This notebook is a fork
test
Mar 24
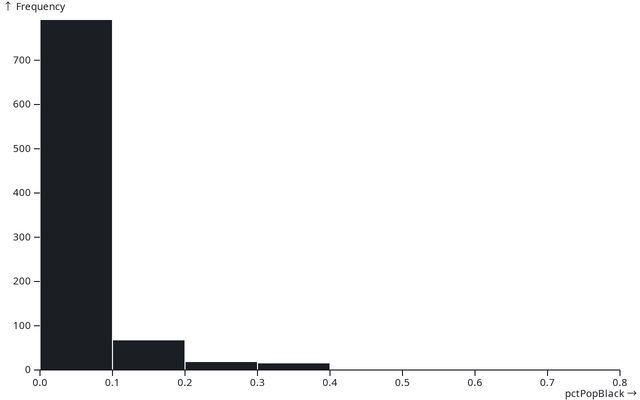
Assignment 2: Classification and Colors Attempt 2
This notebook is a fork
University of Iowa
Mar 25
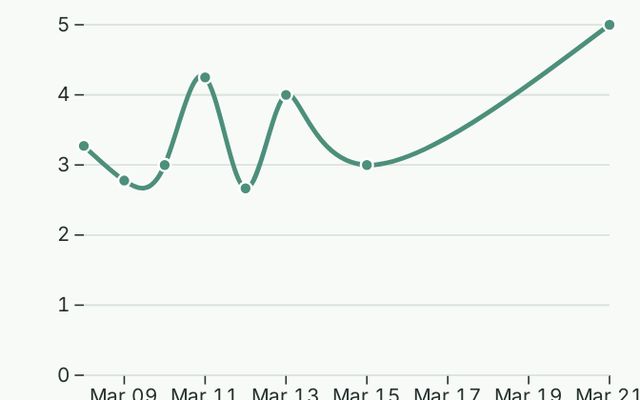
Champions League xG Momentum Charts
Primara
Mar 24
Another example
Matthew
Mar 24
Interaction
Matthew
Mar 24
D3 Force Directed Layout
CIS 671 (InfoViz)
Mar 24
Importing Libraries
SFU
Mar 24
Showing
541-570
of
10,000
notebooks
Prev
Next