Platform
Resources
Pricing
Sign in
Get started
Trending
Recent
Most stars last month
Most stars all time
Recent
Showing
121-150
of
10,000
notebooks
Prev
Next
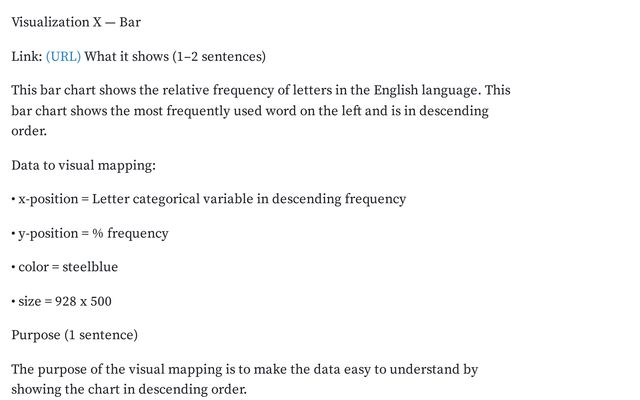
Data Visualization (recreate chart)
workspace
Apr 1
Course work (first charts)
workspace
Apr 1
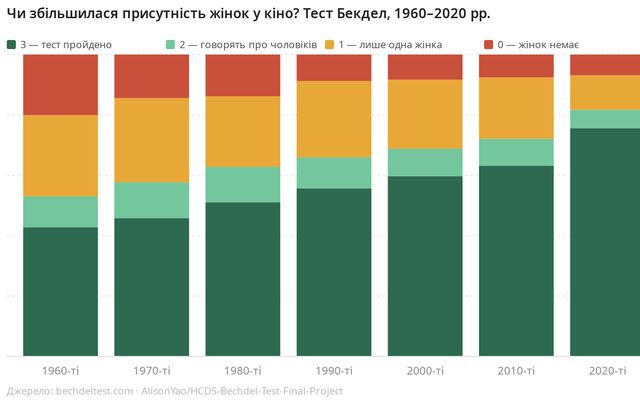
Тест Бекдела та збільшення присутності жінок у кіно
UCU
Apr 1
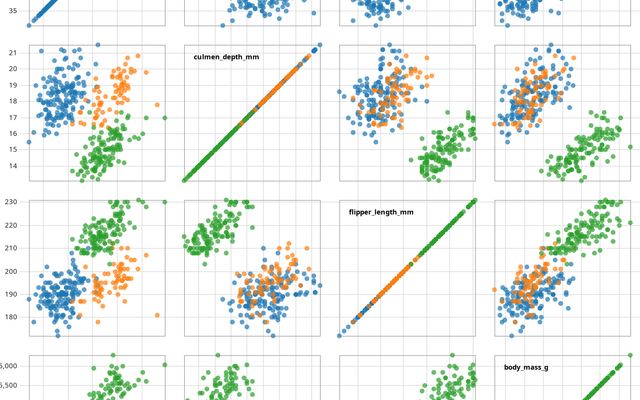
Brushable scatterplot matrix
This notebook is a fork
CSE 478
Apr 1
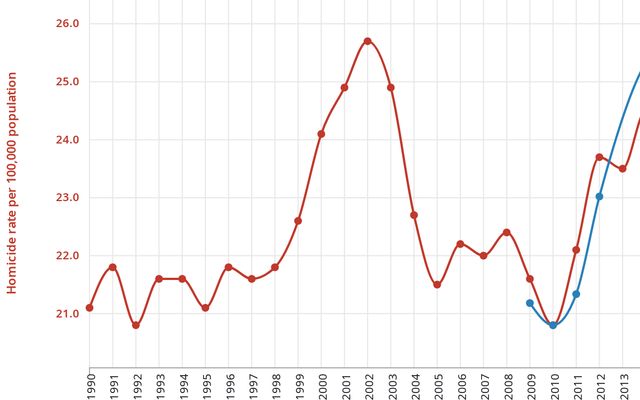
Homicide Rates
Prueba
Apr 1
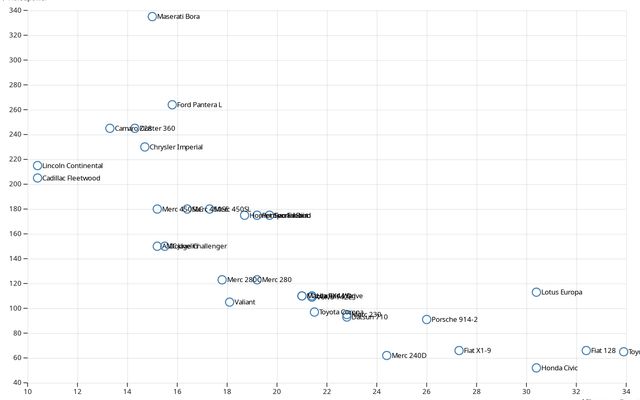
Scatterplot
This notebook is a fork
CSE 478
Apr 1
Test notebook
Tun
Apr 1
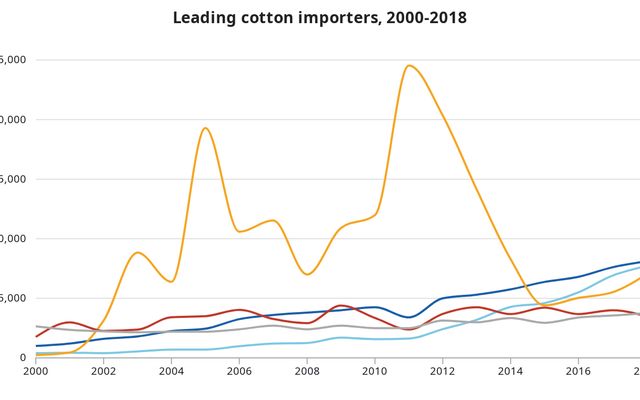
Global cotton supply and use
Prueba
Apr 1
EHS - Public
Prueba
Apr 1
Line chart
This notebook is a fork
CSE 478
Apr 1
Blackson_Jarrett_D3_Exploration
478
Apr 1
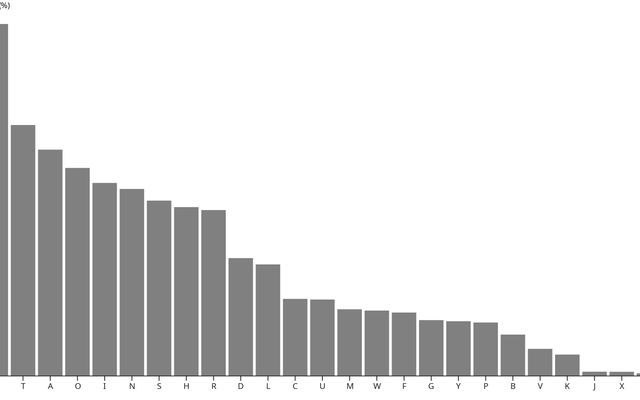
Histogram
This notebook is a fork
ASU
Apr 1
Dublin Stats
Prueba
Apr 1
Line chart
This notebook is a fork
Arizona State University
Apr 1
Тривалість світлового дня у Стокгольмі в 2026 році
UCU
Apr 1
Bar chart
This notebook is a fork
CSE 478
Apr 1
DataViz2
observable-proj
Apr 1
Area chart
This notebook is a fork
ASU
Apr 1
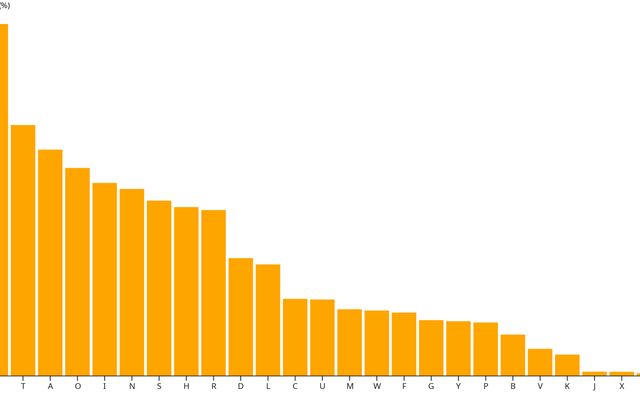
Bar chart
This notebook is a fork
ASU
Apr 1
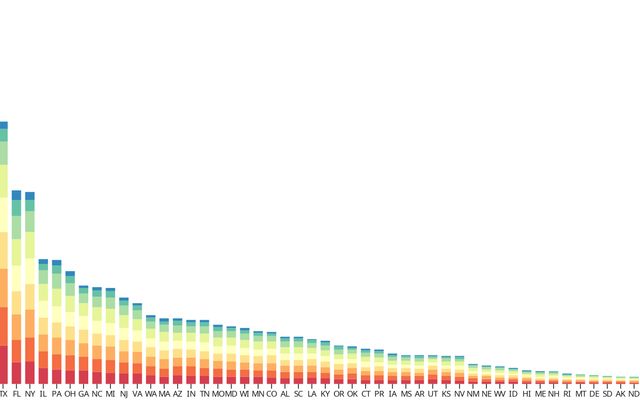
Zoomable bar chart
This notebook is a fork
INclass
Apr 1
Box plot
This notebook is a fork
In-Class
Apr 1
Line chart with tooltip
This notebook is a fork
ASU
Apr 1
Scatterplot
This notebook is a fork
In-Class
Apr 1
Scatterplot with shapes
This notebook is a fork
INclass
Apr 1
Band chart
This notebook is a fork
In-Class
Apr 1
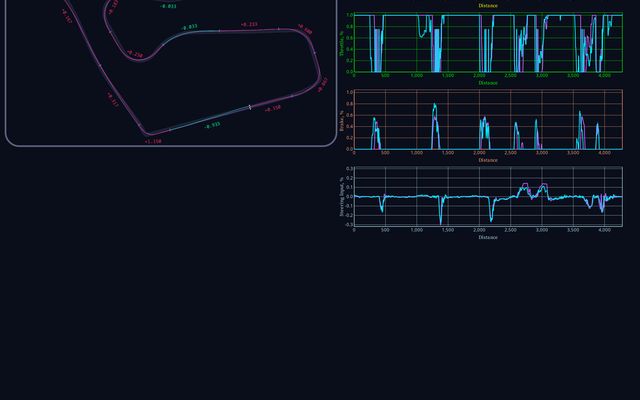
Red Bull Ring
This notebook is a fork
kofful
Apr 2
Stacked bar chart
This notebook is a fork
Arizona State University
Apr 1
Line chart
This notebook is a fork
INclass
Apr 1
Bar chart
This notebook is a fork
In-Class
Apr 1
Bar chart
This notebook is a fork
INclass
Apr 1
Showing
121-150
of
10,000
notebooks
Prev
Next