Platform
Resources
Pricing
Sign in
Get started
Trending
Recent
Most stars last month
Most stars all time
Recent
Showing
151-180
of
10,000
notebooks
Prev
Next
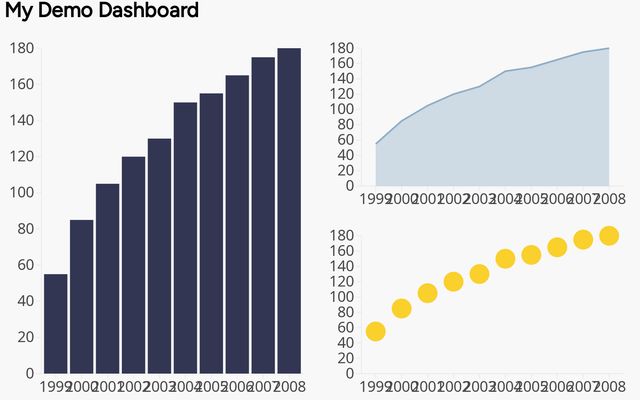
Three Simple Charts - on a dashboard!
This notebook is a fork
bmdatavisualisation
Mar 31
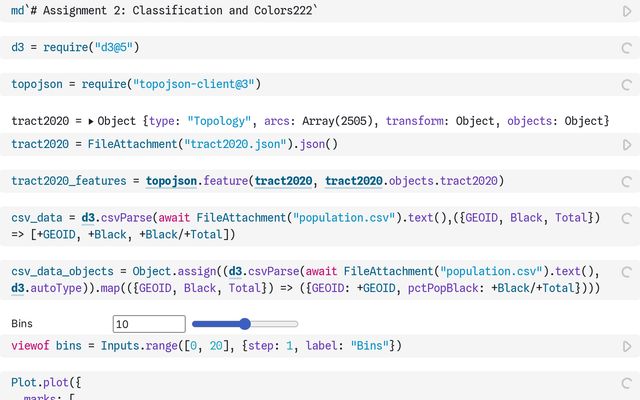
Assignment 2: Classification and Colors222
This notebook is a fork
University of Iowa
Mar 31
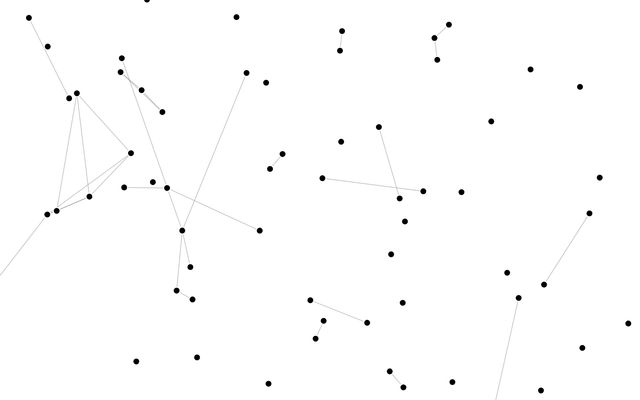
Temporal force-directed graph
This notebook is a fork
Arizona State University
Mar 31
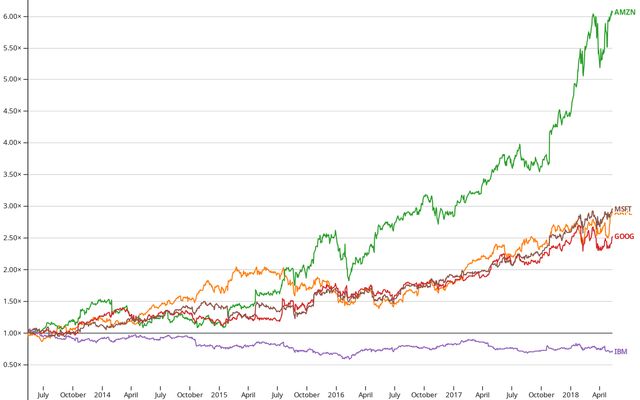
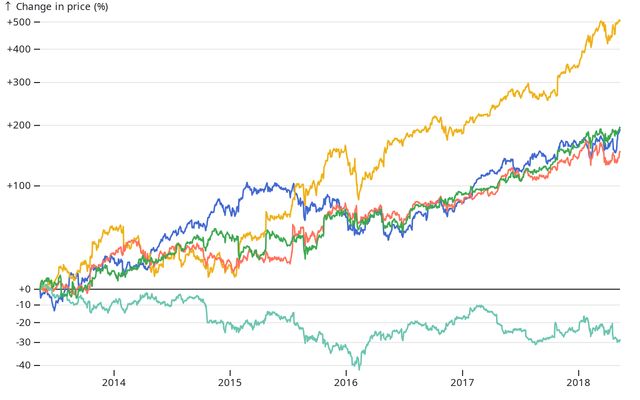
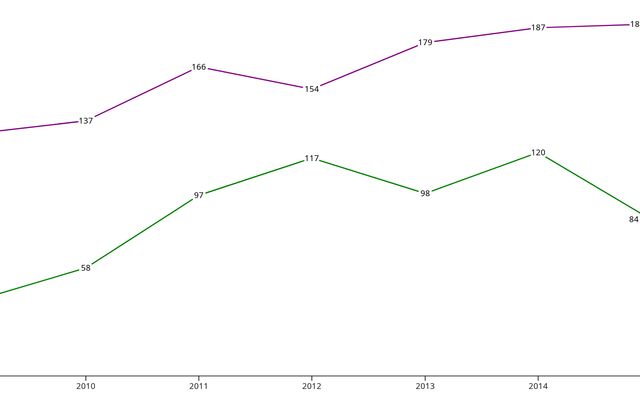
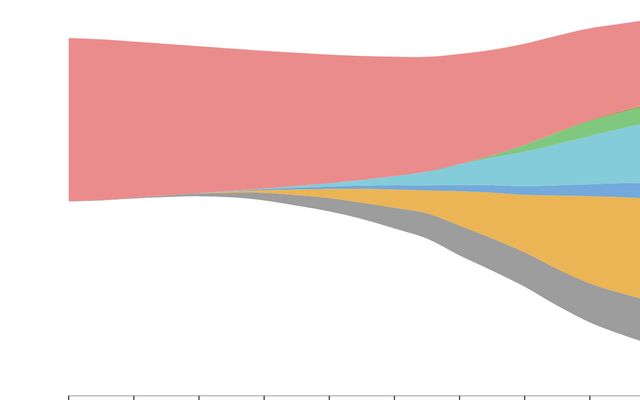
Index chart
This notebook is a fork
Arizona State University
Mar 31
Index chart
This notebook is a fork
Arizona State University
Mar 31
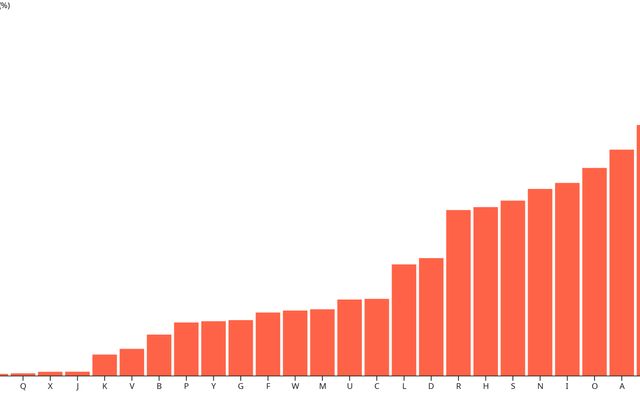
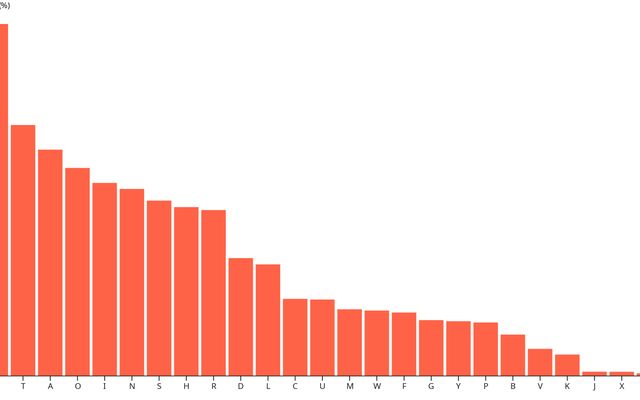
Bar chart
This notebook is a fork
Arizona State University
Mar 31
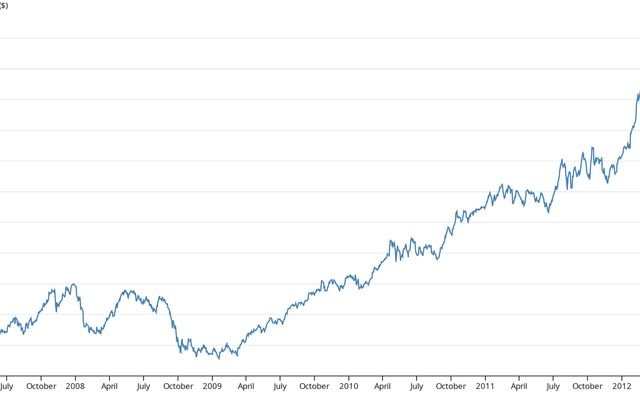
Line chart
This notebook is a fork
Arizona State University
Mar 31
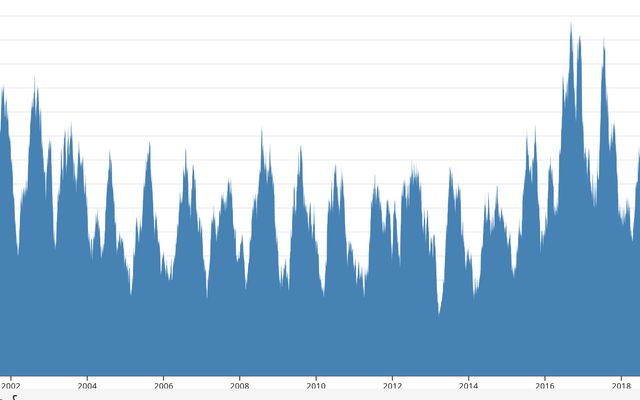
Moving average
This notebook is a fork
ritvikg
Mar 31
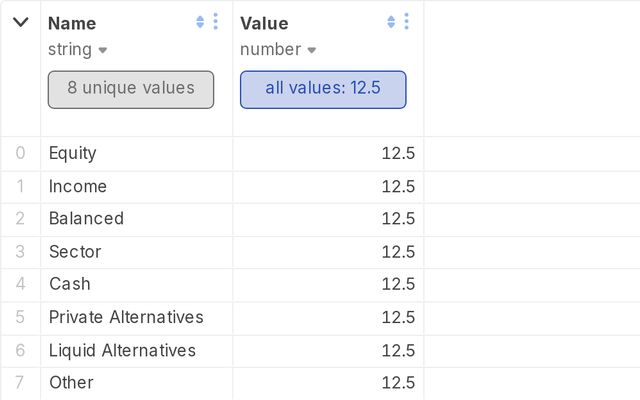
Donut chart
This notebook is a fork
redtest
Mar 31
Inline labels
This notebook is a fork
ritvikg
Mar 31
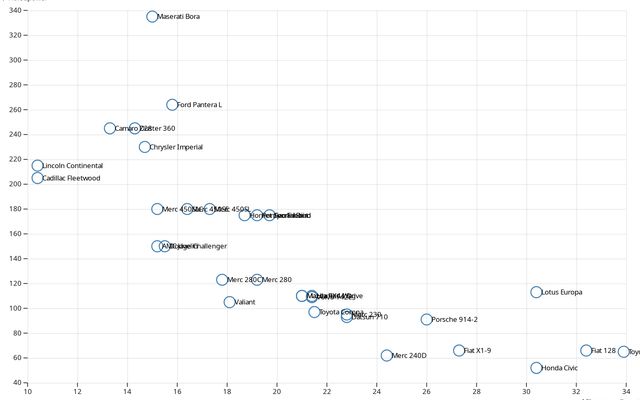
Scatterplot
This notebook is a fork
ritvikg
Mar 31
Bar chart
This notebook is a fork
ritvikg
Mar 31
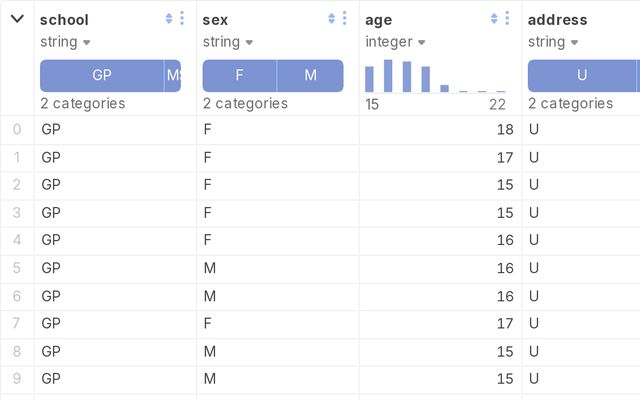
student grades alcohol vizu notebook
This notebook is a fork
VIS2026
Mar 31
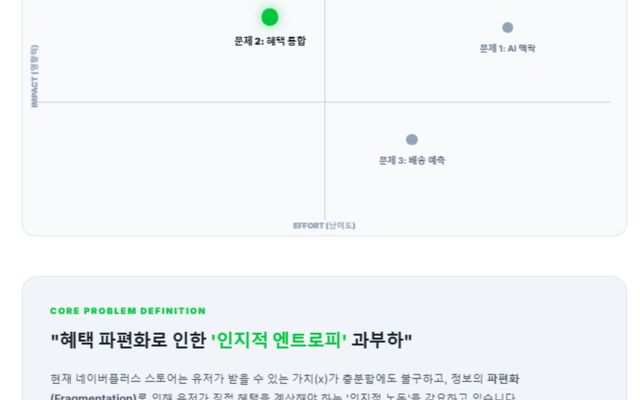
어제 로직과 함수 그리고 논문을 응용해서 지미나이에게 핸들링을 맞긴 과제를 돌아보았다, 어제의 Til을 복기했다
til
Mar 31
•
5
Test font export
Data Visualisation Design
Mar 31
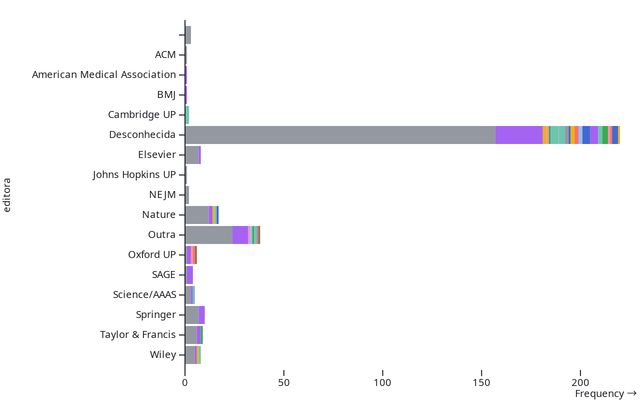
#ICanHazPDF_Mastodon
Ciência Livre
Mar 31
student grades alcohol vizu notebook
d3 tut
Mar 31
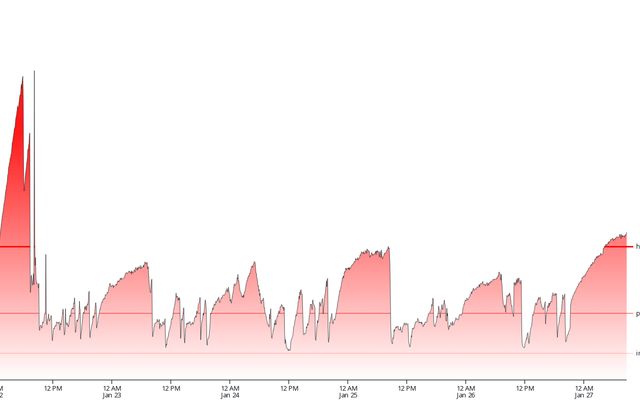
Amount of C02 in my household as per my IOT sensor
Kallol Chatterjee
Mar 31
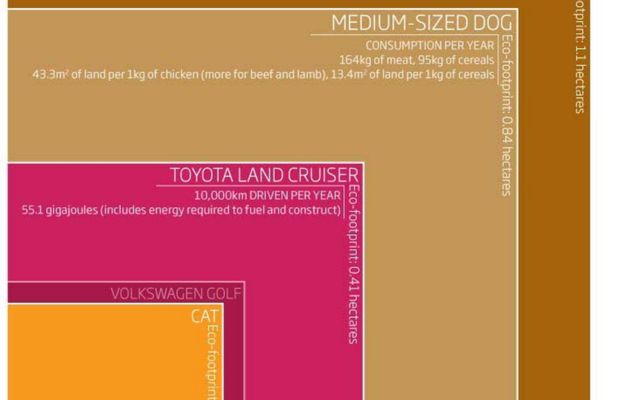
Land guzzlers
Brooke Lumpkin
Mar 31
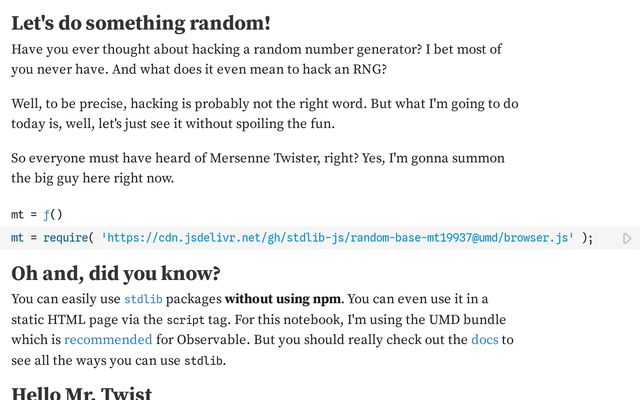
HackenneTwister19937
Hello Observable
Apr 3
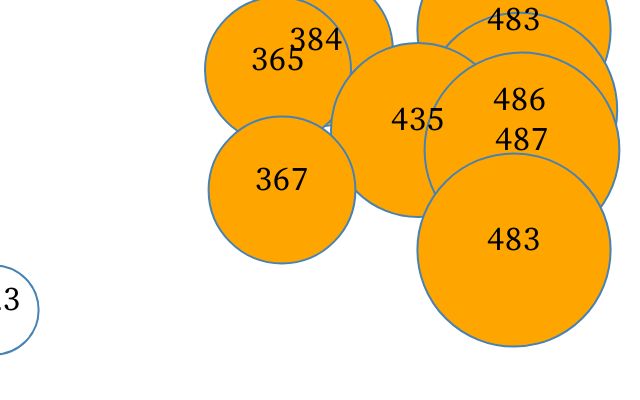
Dynamic data
This notebook is a fork
UVA
Mar 31
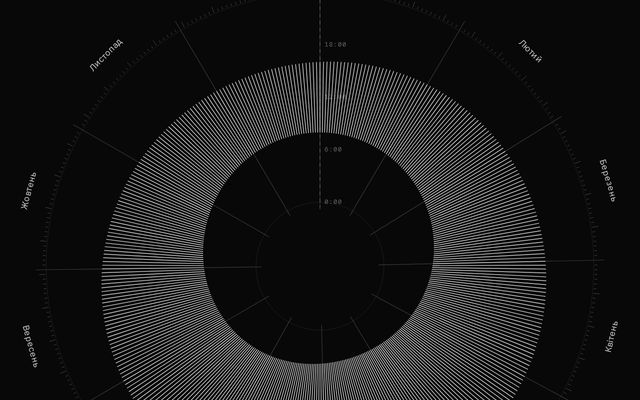
Київ 2003
Study
Mar 31
Energy Consumption Animated
Prueba
Mar 31
Demo Dashboard with 4 charts
This notebook is a fork
bmdatavisualisation
Mar 31
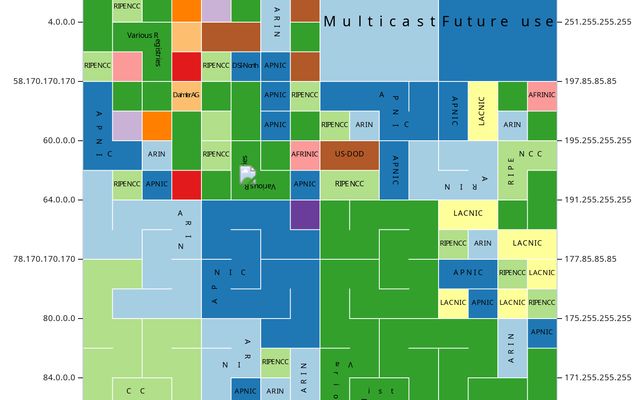
IPv4 Space Dominance
Kallol Chatterjee
Mar 31
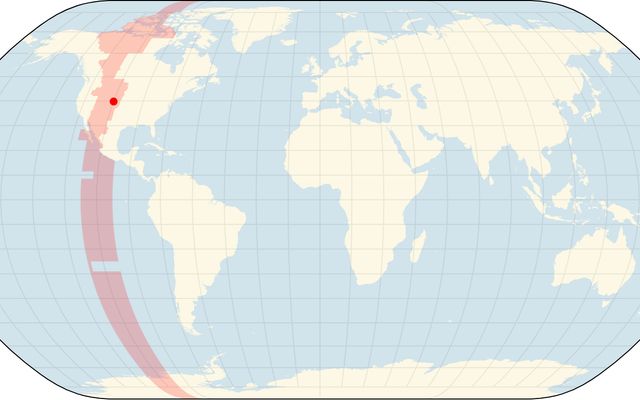
Timezone Mapping
Kallol Chatterjee
Mar 31
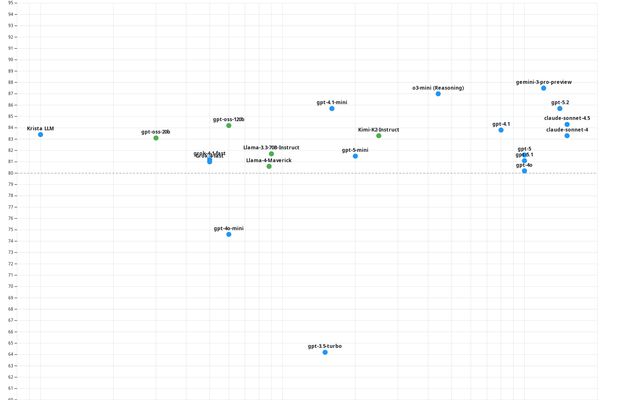
Evaluating LLM Cost on Basis of Price of Performance
Kallol Chatterjee
Mar 31
PIP-XAI Visualisations - Shared
Leeds Institute of Data Analytics (LIDA)
Mar 31
•
1
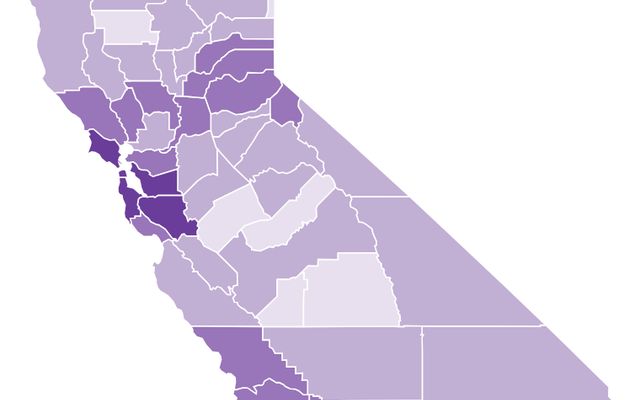
Geography of Educational Attainment in California
Prueba
Mar 31
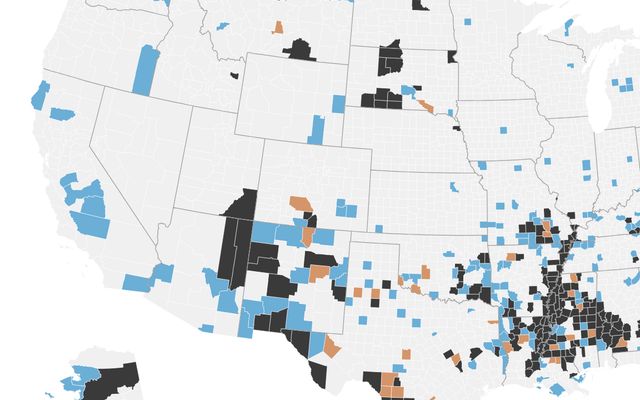
Persistent poverty and high poverty U.S. counties
Prueba
Mar 31
Showing
151-180
of
10,000
notebooks
Prev
Next