Platform
Resources
Pricing
Sign in
Get started
Trending
Recent
Most stars last month
Most stars all time
Recent
Showing
181-210
of
10,000
notebooks
Prev
Next
How I use Observable
This notebook is a fork
Andrew Witherspoon
Apr 2
Learning Vis Tools Tutorial 7: Vega-Lite and data processing libraries
This notebook is a fork
王琮睿
Mar 31
Estimate Economic Returns on Adaptation
This notebook is a fork
Bako Natioanl Maize Research Center
Mar 31
Estimate Economic Returns on Adaptation
This notebook is a fork
Bako Natioanl Maize Research Center
Apr 2
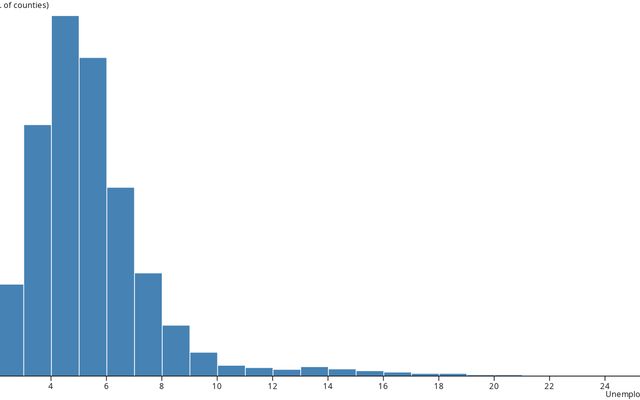
Histogram
This notebook is a fork
Aayush's Workspace
Mar 31
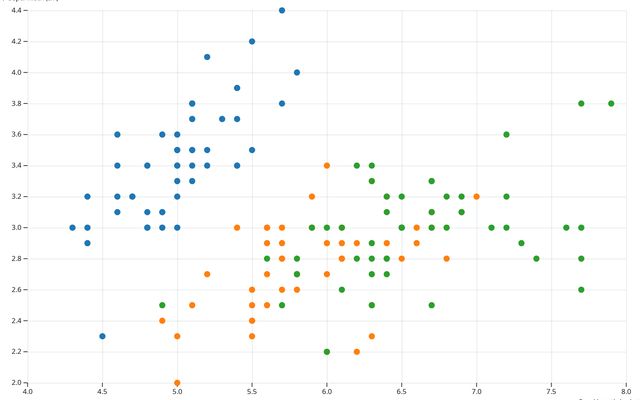
Scatterplot with shapes
This notebook is a fork
Aayush's Workspace
Mar 31
Adapting a D3 Visualization to New Data
This notebook is a fork
vkakadiy
Mar 31
Explore the Datasets
This notebook is a fork
Kiyafenu
Mar 31
Explore the Datasets
This notebook is a fork
Kiyafenu
Mar 31
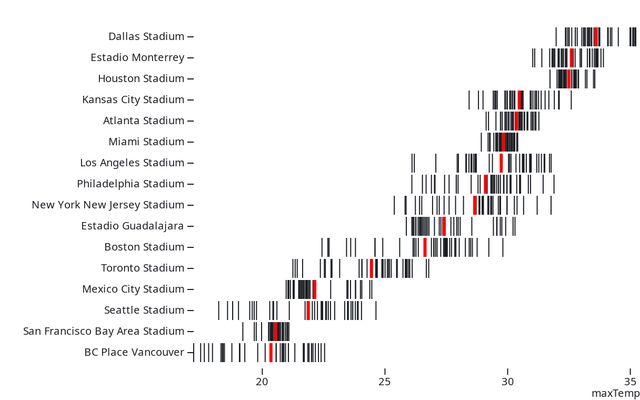
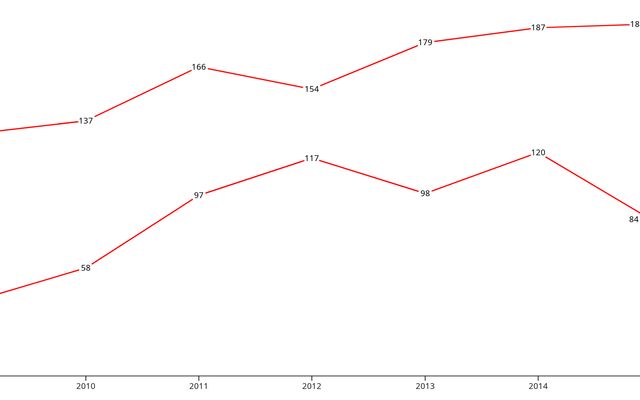
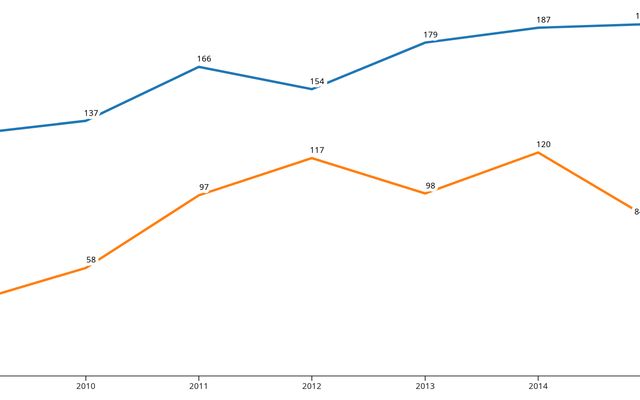
Line chart
This notebook is a fork
Aayush's Workspace
Mar 31
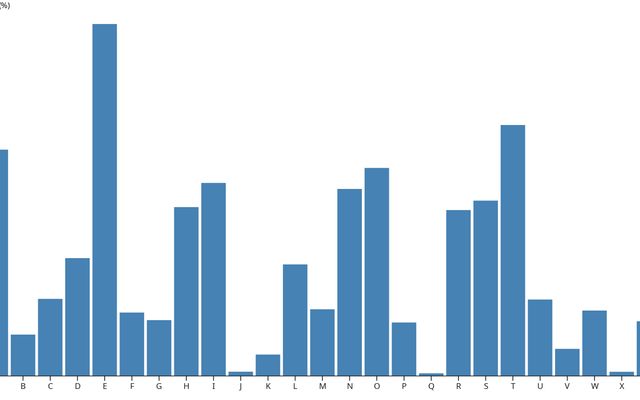
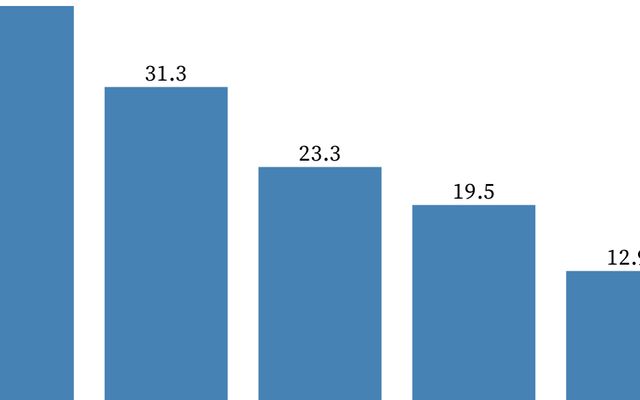
Bar chart
This notebook is a fork
Aayush's Workspace
Mar 31
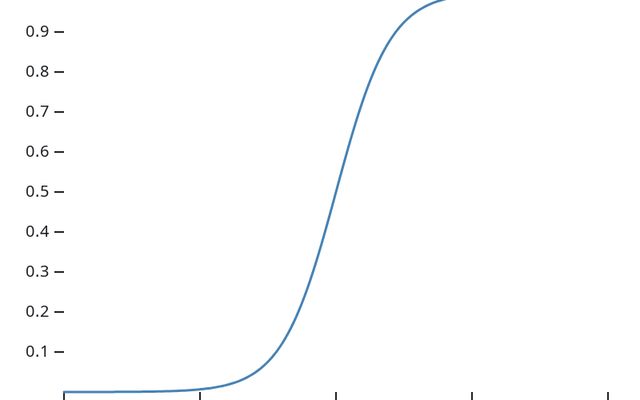
Sigmoid Function
Bhargav Kowshik
Mar 31
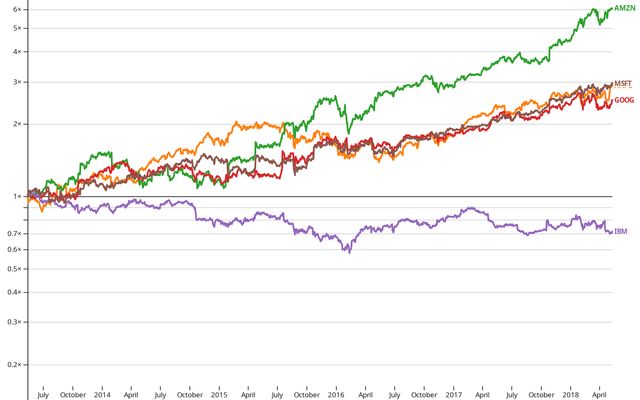
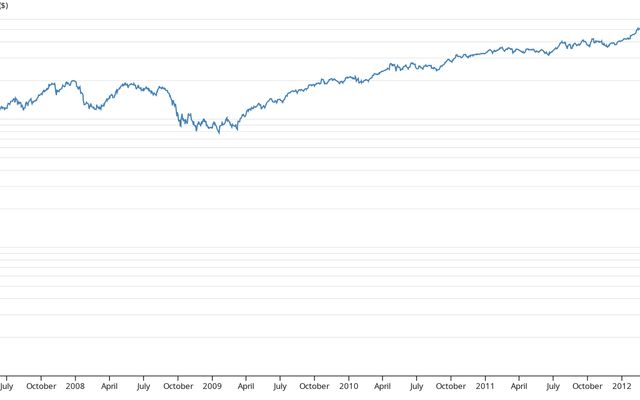
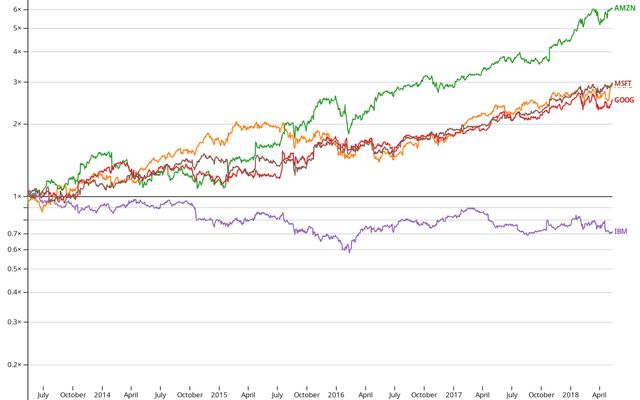
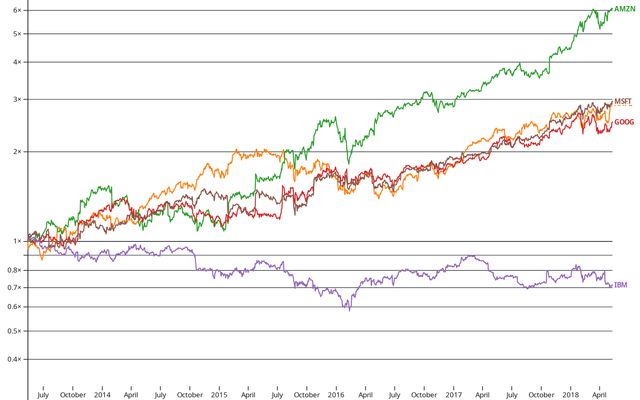
Index chart
This notebook is a fork
Rohan Byrapuneni
Mar 31
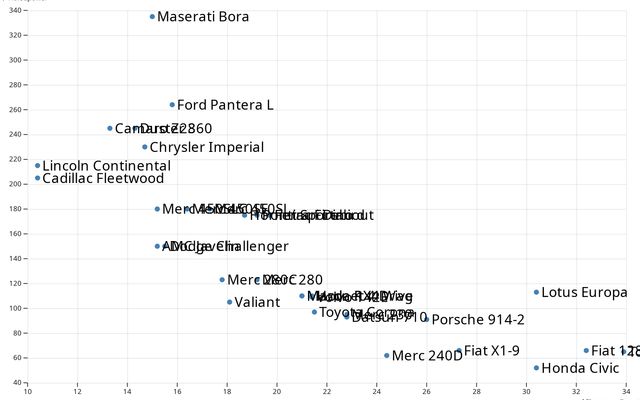
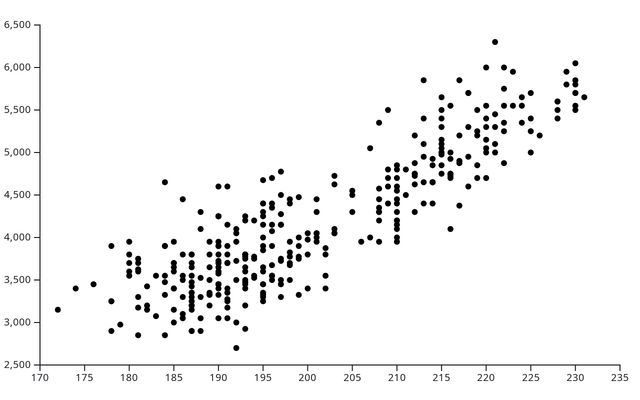
Scatterplot
This notebook is a fork
Rohan Byrapuneni
Mar 31
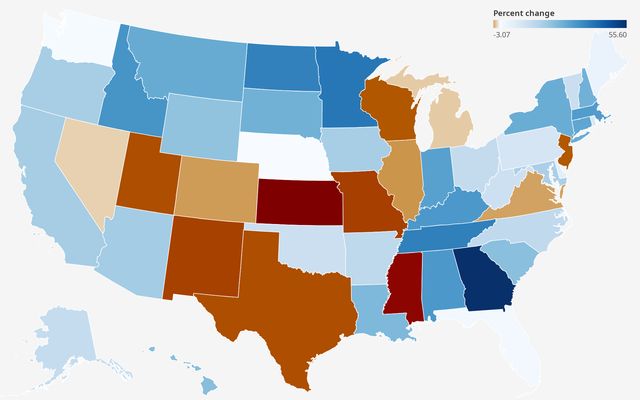
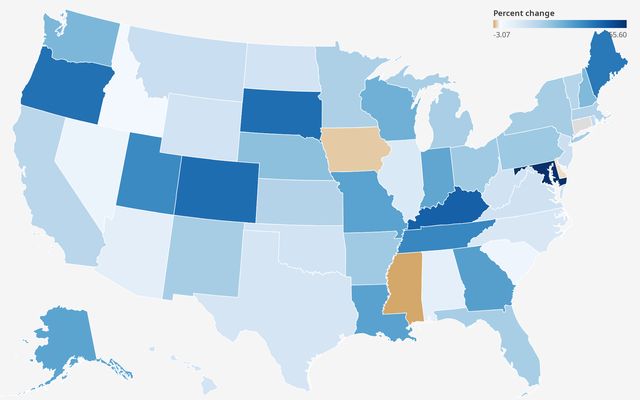
Percent Change in Past Year Cocaine Use 2011 -2016 by state
Prueba
Mar 31
Line chart
This notebook is a fork
Rohan Byrapuneni
Mar 31
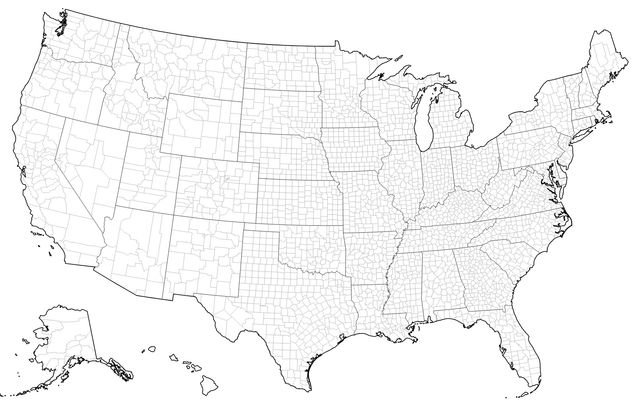
D3 U.S. map
This notebook is a fork
vkakadiy
Mar 31
D3 scatterplot
This notebook is a fork
vkakadiy
Mar 31
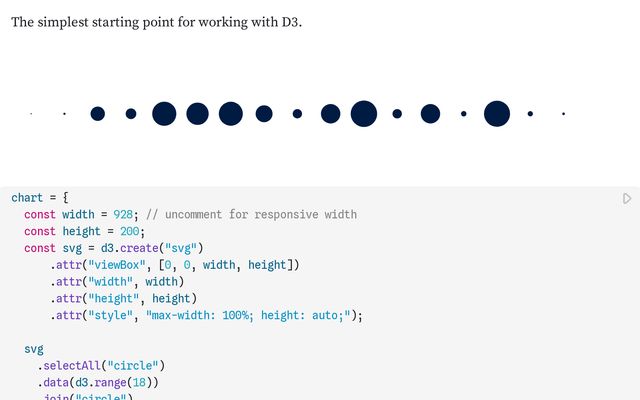
Simple D3
This notebook is a fork
vkakadiy
Mar 31
Percent Change in Marijuana Use 2011 to 2016 by State
Prueba
Mar 31
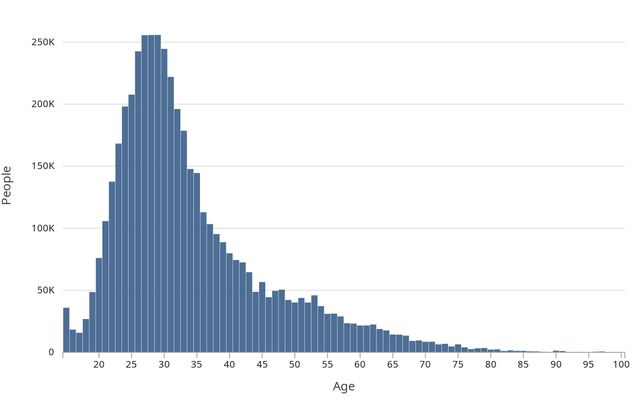
Plot: Histogram
This notebook is a fork
vkakadiy
Mar 31
How Old Are Recent Newlyweds?
Prueba
Mar 31
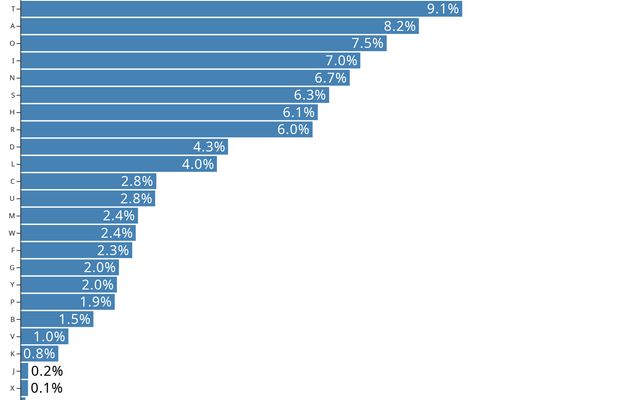
Horizontal bar chart
This notebook is a fork
Rohan Byrapuneni
Mar 31
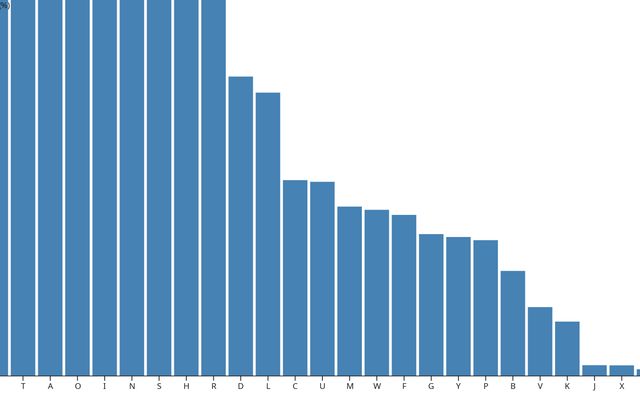
Bar chart
This notebook is a fork
ASU
Mar 31
Inline labels
This notebook is a fork
ASU
Mar 31
Index chart
This notebook is a fork
ASU
Mar 31
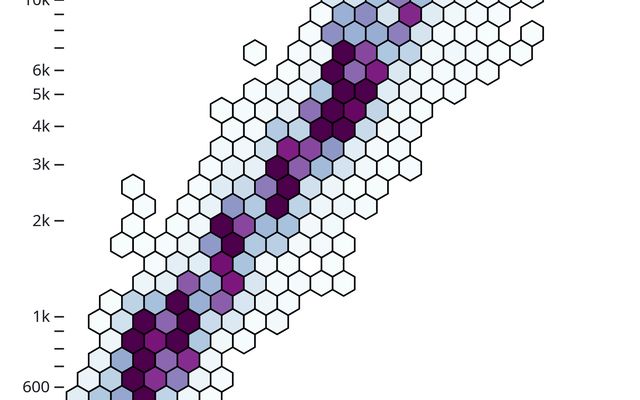
Hexbin
This notebook is a fork
Spring 2026 - CSE 478
Mar 31
Dynamic data
This notebook is a fork
Ryan's Workspace
Mar 31
Index chart
This notebook is a fork
Spring 2026 - CSE 478
Mar 31
Inline labels
This notebook is a fork
Spring 2026 - CSE 478
Mar 31
Showing
181-210
of
10,000
notebooks
Prev
Next