Notebooks
Resources
Pricing
Sign in
Get started
Trending
Recent
Most stars last month
Most stars all time
Recent
Showing
511-540
of
10,000
notebooks
Prev
Next
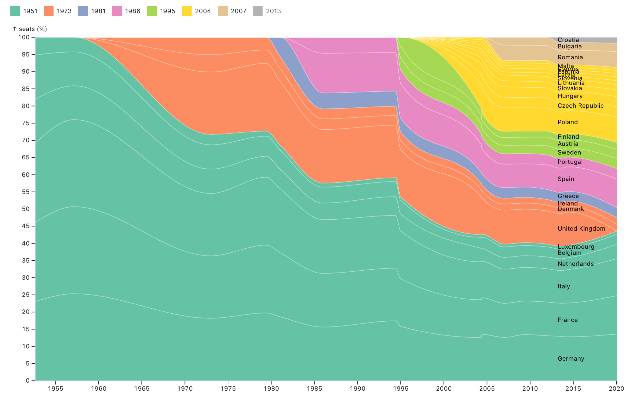
Apportionment of seats in the European Parliament
Observable
Jun 15
•
2
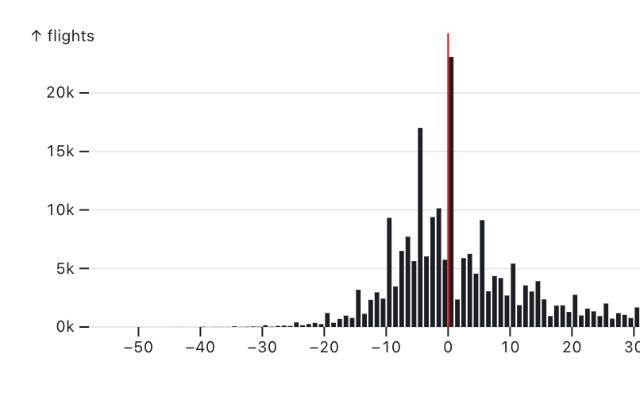
Flight delays
Observable
Jun 15
•
1
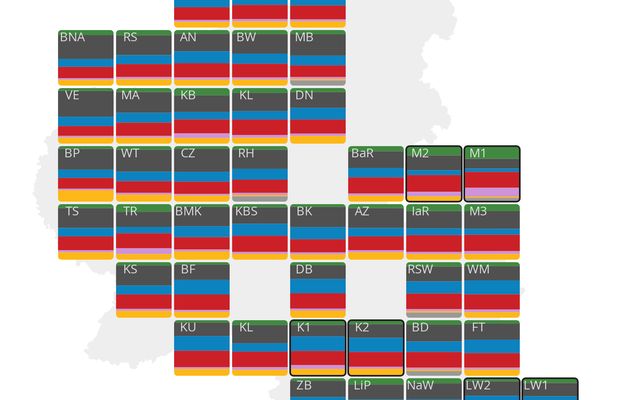
Landtagswahl RLP 18.05.2026
This notebook is a fork
lab
Jun 15
Search + Table
This notebook is a fork
kevinfiol
Jun 15
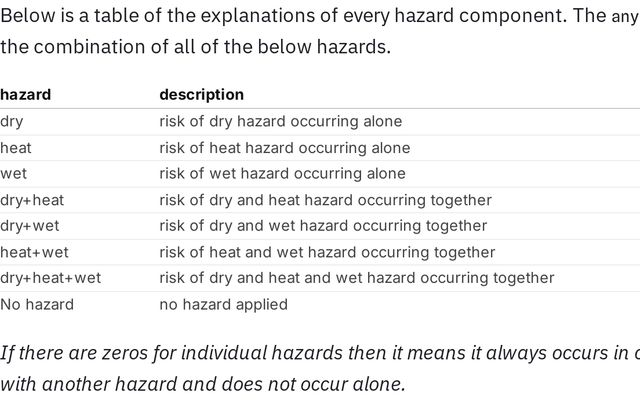
Evaluate Climate Risks
This notebook is a fork
Kiyafenu
Jun 15
Evaluate Climate Risks
This notebook is a fork
Kiyafenu
Jun 15
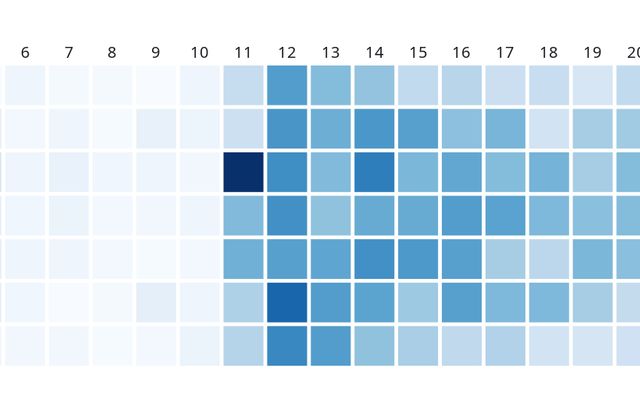
Heatmap
Alessandra Clemente
Jun 15
Ball Analysis Visualizer
RealHolyz
Jun 15
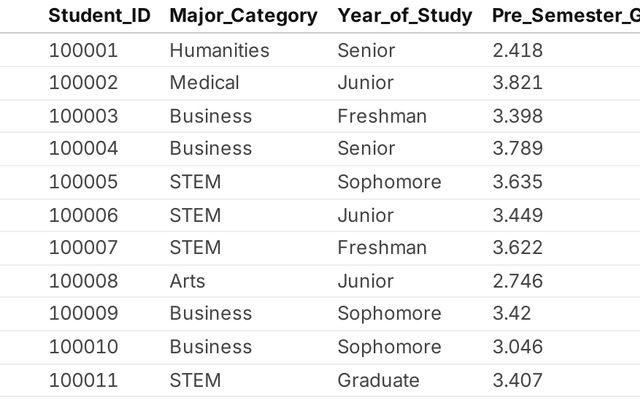
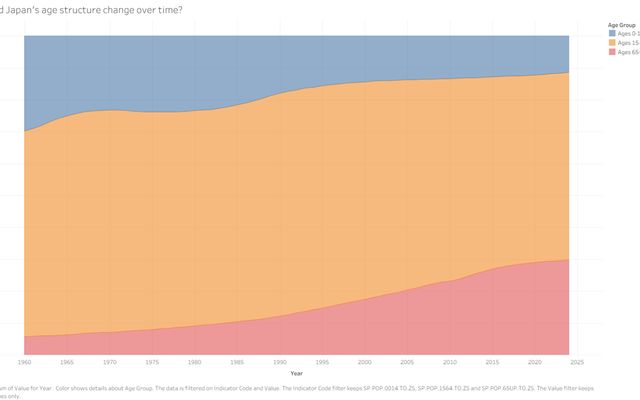
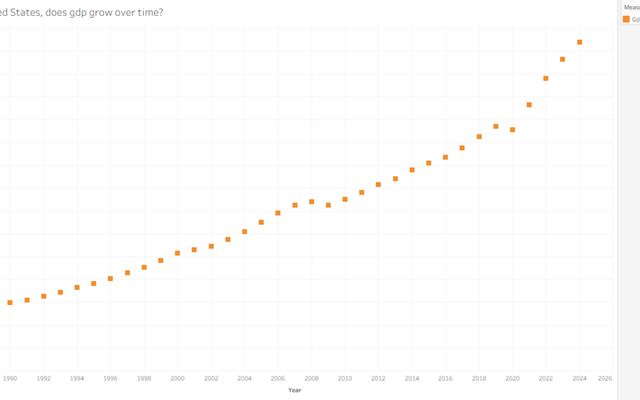
Assignment 2: EDA
Jimson Sou
Jun 16
Assignment 2: Exploratory Data Analysis
This notebook is a fork
Spencer LeBleu
Jun 15
Sankey diagram
This notebook is a fork
Alessandra Clemente
Jun 15
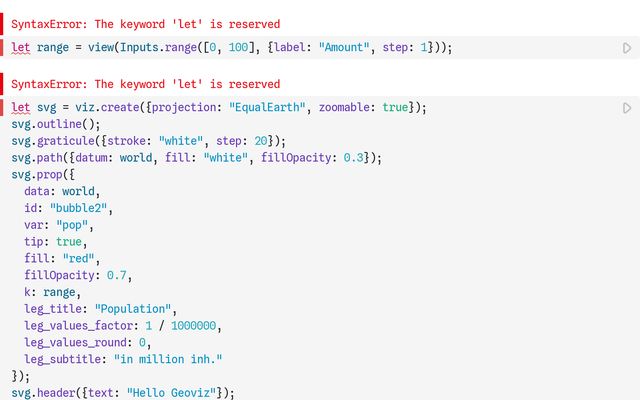
My first “New Observable” Notebook
Nicolas Lambert
Jun 15
Assignment 2:
blinkatl
Jun 15
Week 7 Assignment
Berkeley MIDS W209 Information Visualization Course
Jun 15
Bar Chart Race, Explained
This notebook is a fork
NhejOhE
Jun 15
Assignment 2
Glory King
Jun 15
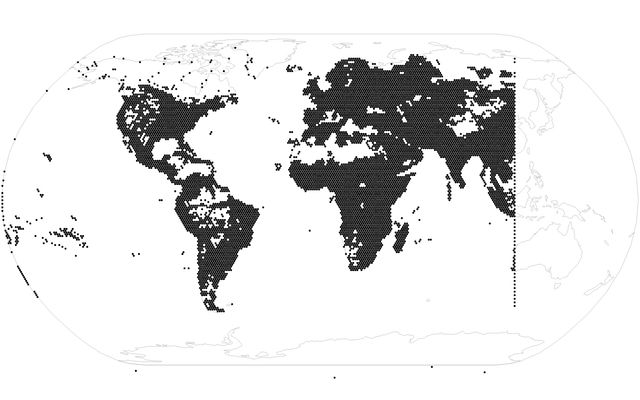
Population à la Bertin
This notebook is a fork
Bianchi Dy
Jun 15
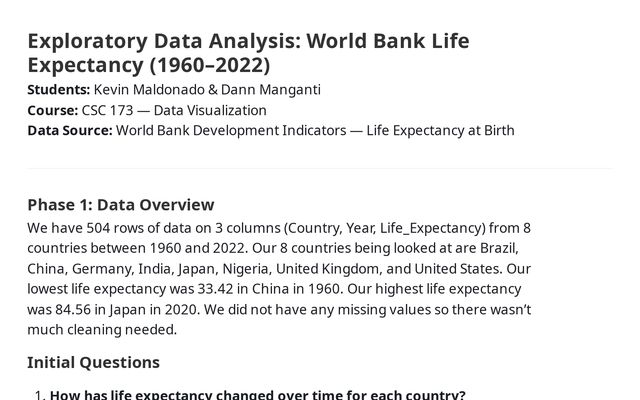
Life Expectancy EDA - CSC 173 Assignment 2
Kevin Maldonado
Jun 16
Simple WebGL Cube
Computação Gráfica
Jun 15
Esfera Núvem de Pontos
Computação Gráfica
Jun 15
Triangle in WebGL
cg
Jun 15
Esfera Iluminada
Computação Gráfica
Jun 15
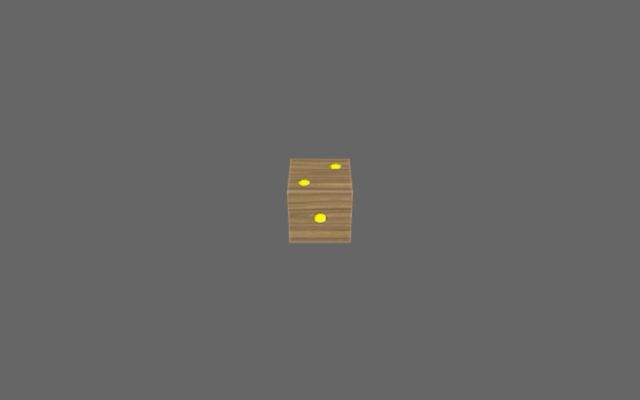
Dado com textura
cg
Jun 15
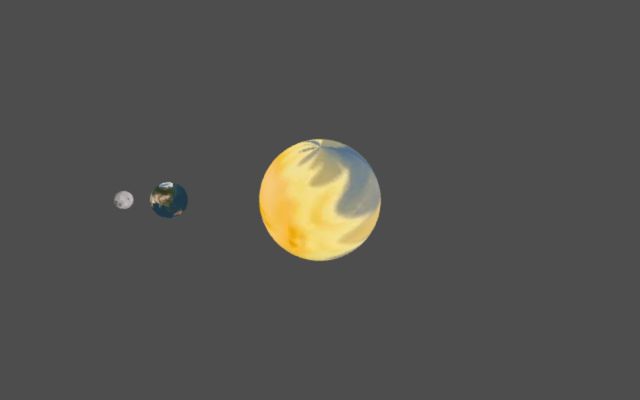
Revolution B
cg
Jun 15
Esfera Iluminada
Computação Gráfica
Jun 15
Esfera Iluminada
cg
Jun 15
Esfera Iluminada
cg
Jun 15
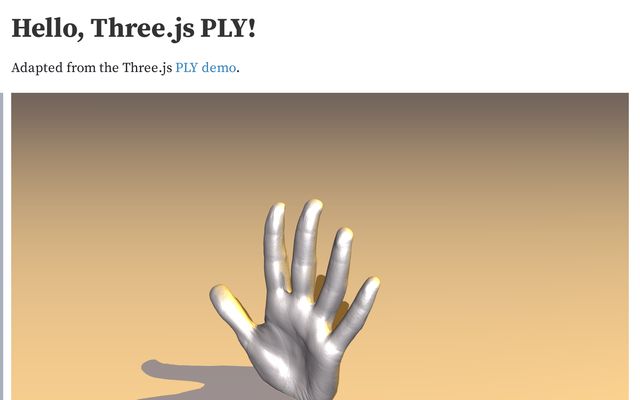
Hello, Three.js PLY!
cg
Jun 15
Dodecaedro Regular
cg
Jun 15
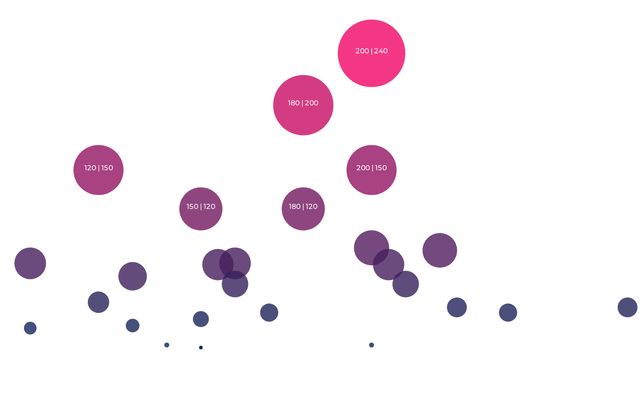
SCALED CIRCLES
This notebook is a fork
Fer
Jun 14
Showing
511-540
of
10,000
notebooks
Prev
Next