Notebooks
Resources
Pricing
Sign in
Get started
Trending
Recent
Most stars last month
Most stars all time
Recent
Showing
841-870
of
10,000
notebooks
Prev
Next
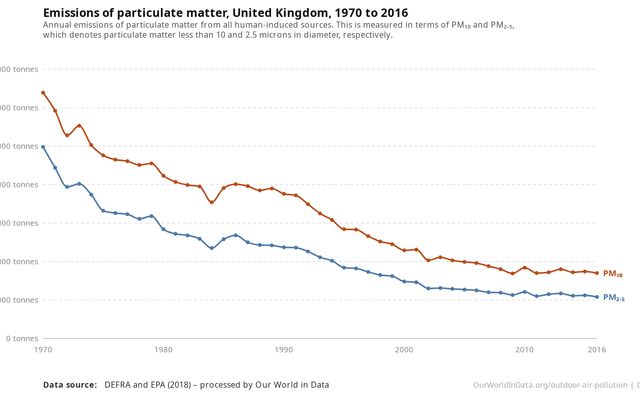
Emissions of particulate matter, UK
Data FYP
May 31
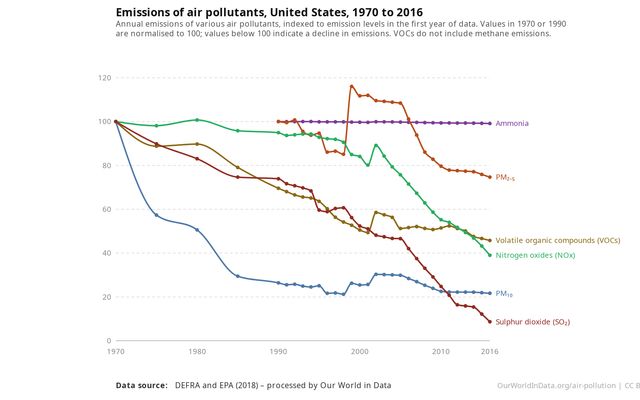
Emissions of air pollutants, US
Data FYP
May 31
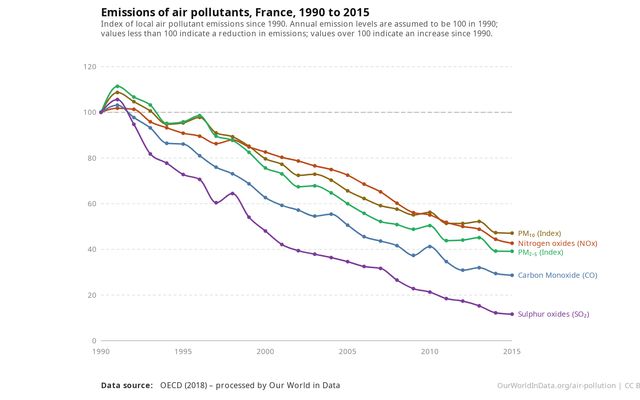
Emissions of air pollutants France
Data FYP
May 31
Jett Introduction to Observable
This notebook is a fork
DATAVIS SUMMER
May 31
Week 2 Assignment
This notebook is a fork
Berkeley MIDS W209 Information Visualization Course
May 31
Setting up D3
This notebook is a fork
Berkeley MIDS W209 Information Visualization Course
May 31
My first notebook
DATAVIS SUMMER
May 31
Introduction to Observable
This notebook is a fork
Benjamin Feldstein
May 31
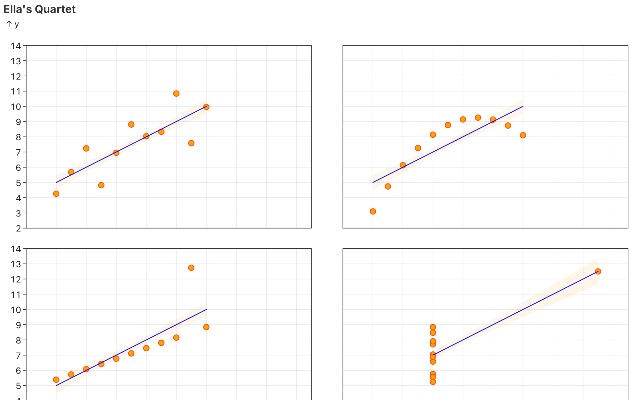
ESuk Introduction to Observable
This notebook is a fork
Ella Suk
May 31
Intro to Observable
DATAVIS SUMMER
May 31
•
1
Project in DataScience
Michaela Hauer's Workspace
May 31
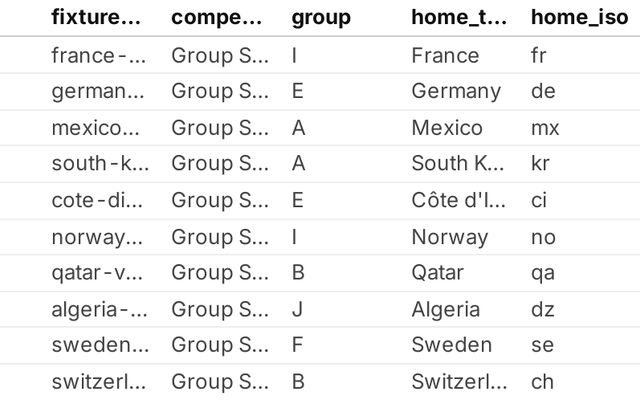
Edges WC2026 SAST Fixtures Dataset
Puntsza-web
May 31
MotherDuck in Observable
Fabian Iwand
May 31
•
1
1
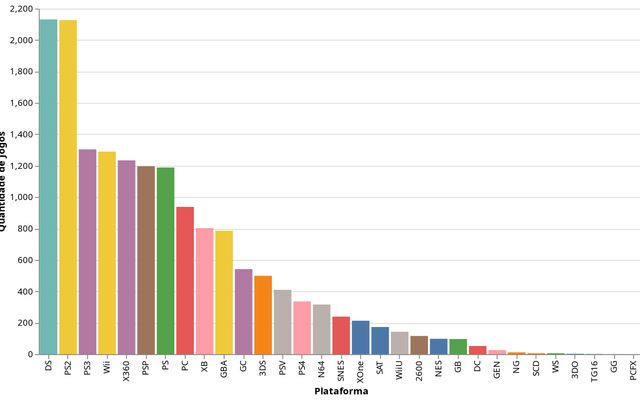
Análise Exploratória de Dados de Vendas de Jogos Eletrônicos
MrPelotade10
May 31
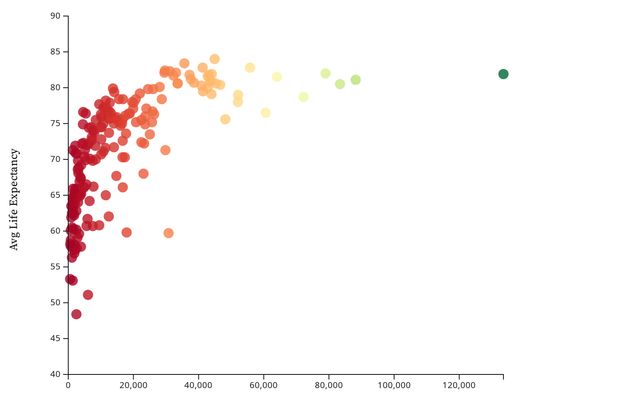
Plot Scatterplot
Vonxlet
May 31
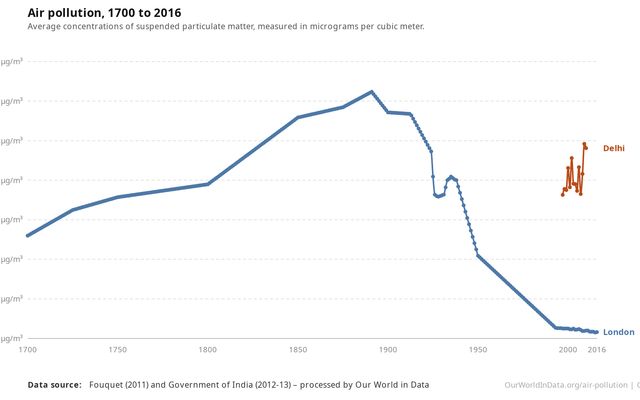
Air pollution
Data FYP
May 31
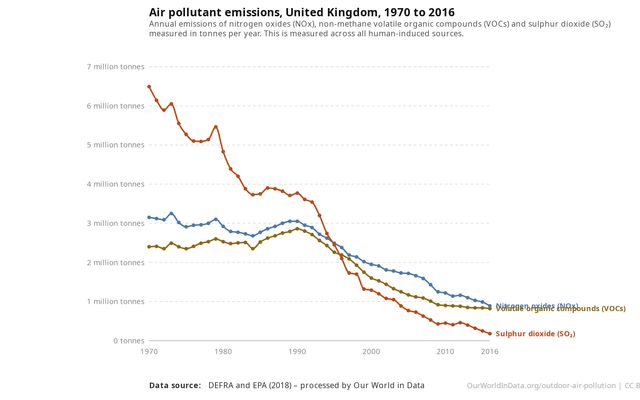
Air pollutant emissions
Data FYP
May 31
Grafico interactivo
Sandraga
May 31
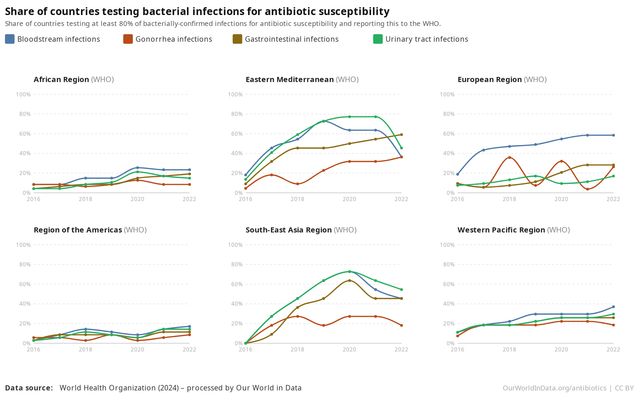
Share of countries testing bacterial infections for antibiotic susceptibility
Data FYP
May 31
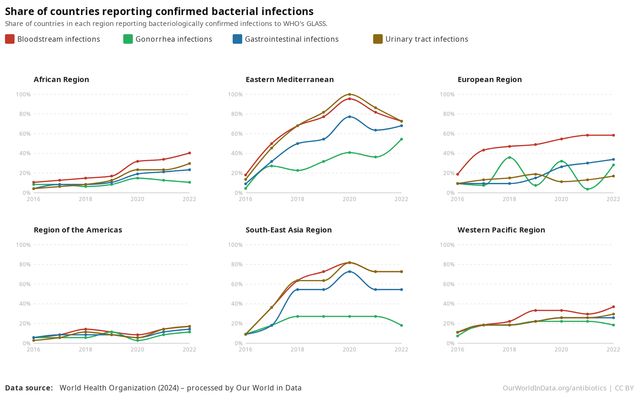
Share of countries reporting confirmed bacterial infections
Data FYP
May 31
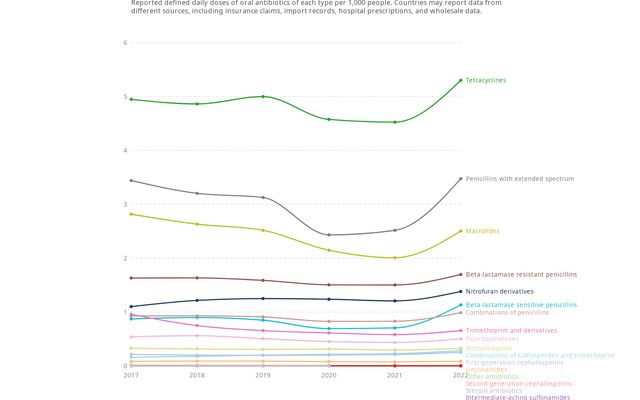
Consumption of oral antibiotics by type
Data FYP
May 31
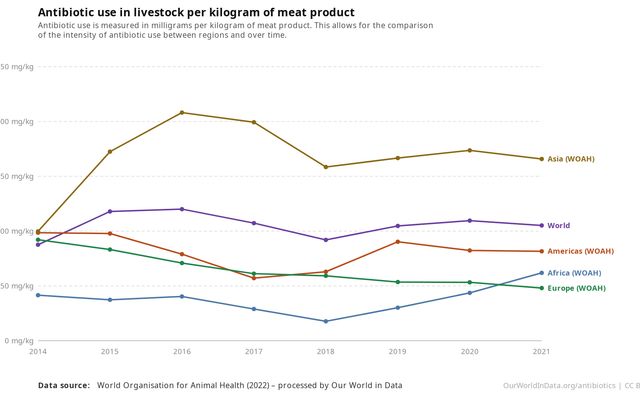
Antibiotic use in livestock per kilogram of meat product
Data FYP
May 31
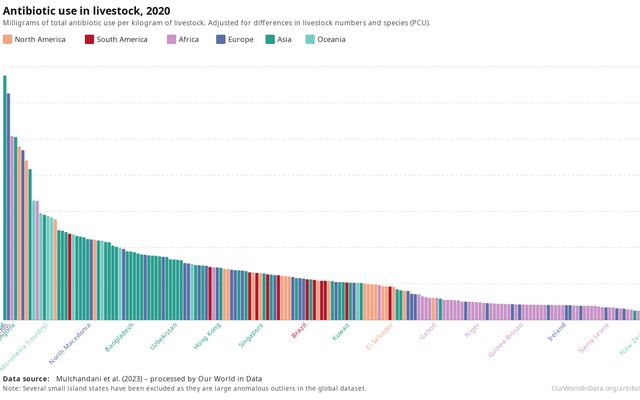
Antibiotic use in livestock, 2020
Data FYP
May 31
Hello,World!Circlesgraph
Skibiditoilet6767
May 31
Estados do Brazil
Osvaldo Jamba
May 31
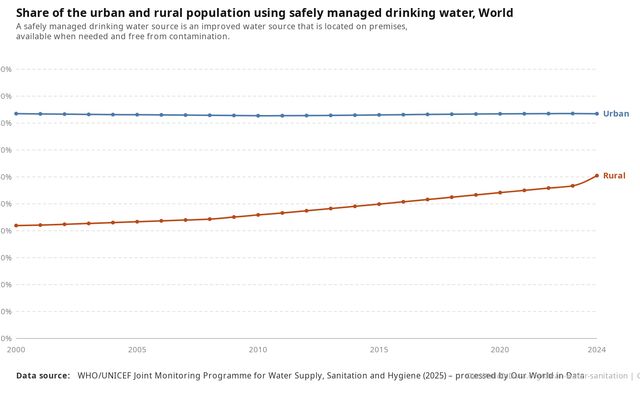
Share of the urban and rural population using safely managed drinking water
Data FYP
May 31
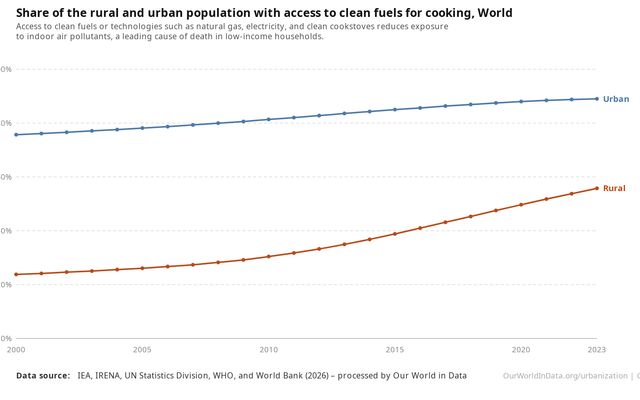
Share of the rural and urban population with access to clean fuels for cooking
Data FYP
May 31
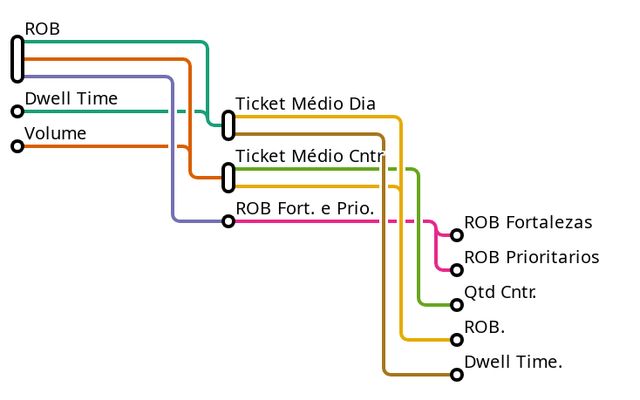
Tangled tree visualization
This notebook is a fork
Henckel
Jun 7
My Submission
Kamil Halim
May 30
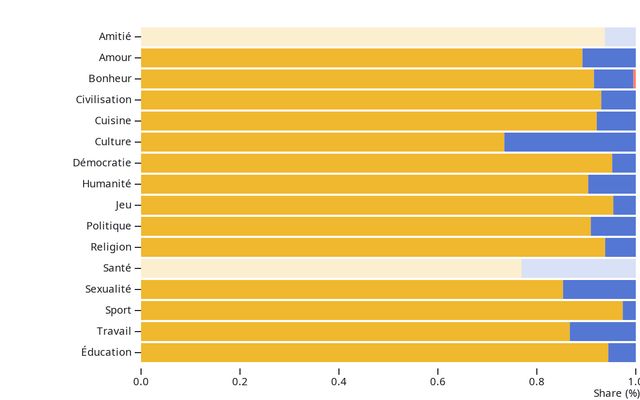
Gender diversity in French Wikipedia's general topics
This notebook is a fork
PAC
May 30
Showing
841-870
of
10,000
notebooks
Prev
Next