Notebooks
Resources
Pricing
Sign in
Get started
Trending
Recent
Most stars last month
Most stars all time
Trending
Showing
31-60
of
72
notebooks
Prev
Next
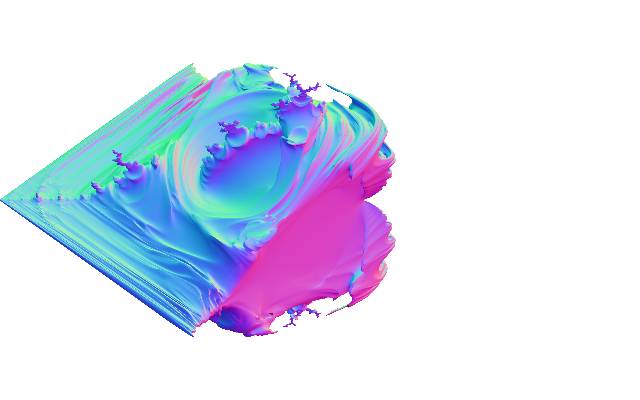
Hypercomplex
nxrix
Jun 20
•
6
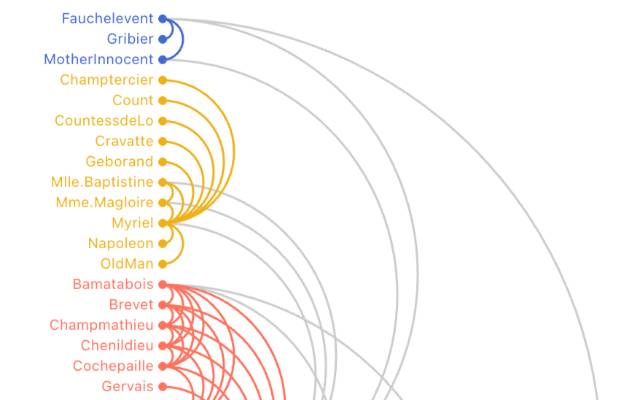
Arc diagram
Observable
Jun 22
•
4
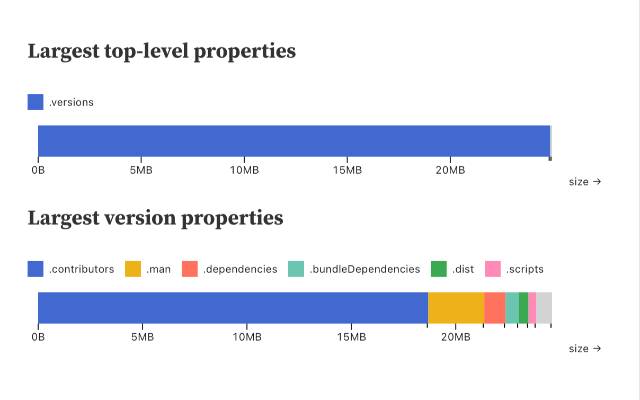
Chonky NPM Packument Props
Fabian Iwand
Jun 22
•
4
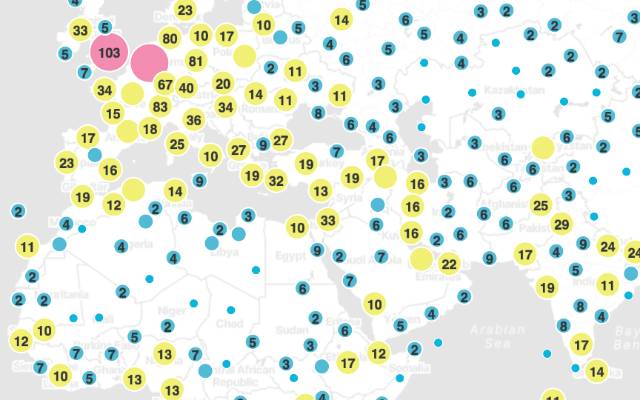
Hello, Supercluster
Fil
Jun 16
•
9
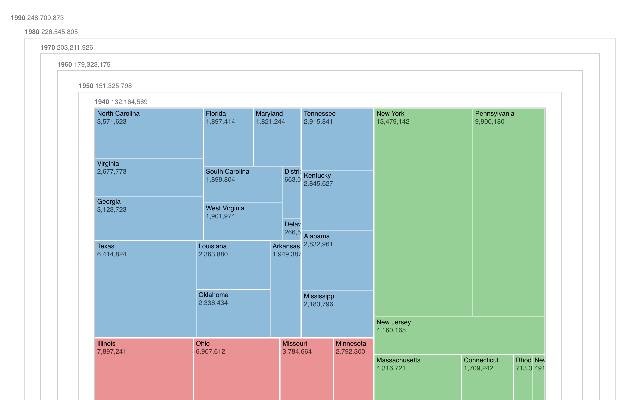
Animated treemap
Observable
Jun 19
•
4
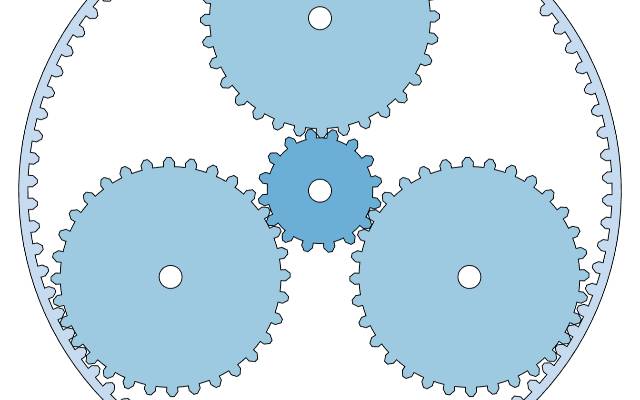
Epicyclic gearing
Observable
Jun 19
•
4
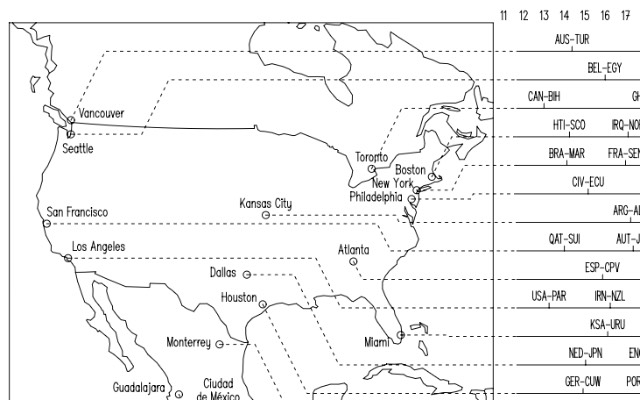
World cup data visualisations
Philippe Deschaseaux
Jun 12
•
11
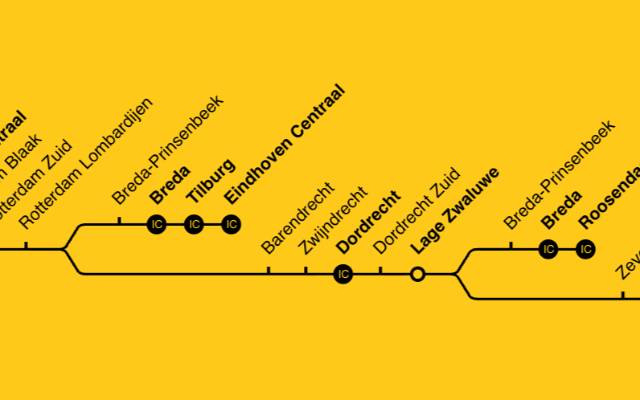
NS Line Diagrams
Jules Blom
Jun 11
•
12
Bitmap to lines using distribution relaxation and TSP
Philippe Deschaseaux
Jun 12
•
9
2
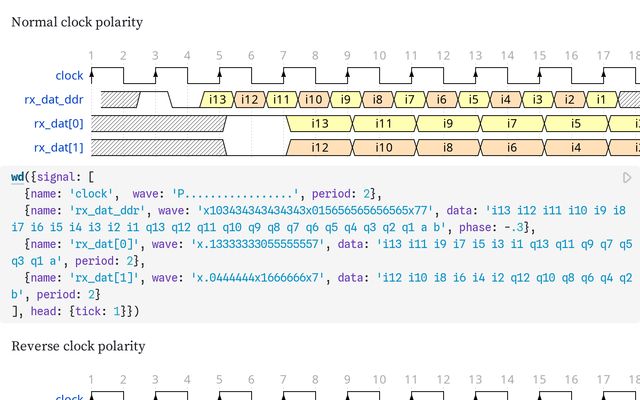
LVDS
Aliaksei Chapyzhenka
Jun 19
•
3
Notebooks 2.0 system guide
Observable
Jun 12
•
8
1
Notebooks 2.0 user guide
Observable
Jun 12
•
6
2
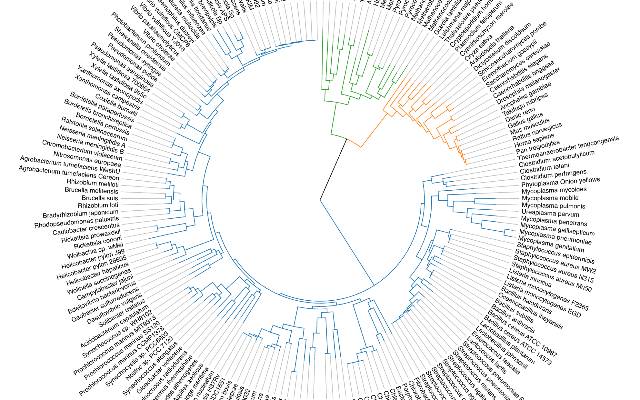
Tree of Life
Observable
Jun 16
•
3
Upgrading to Notebooks 2.0
Observable
Jun 12
•
5
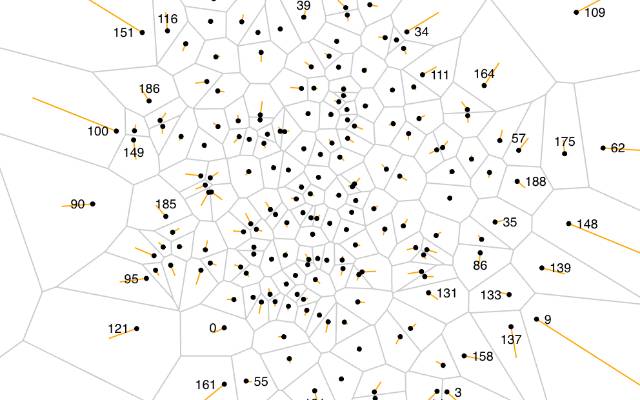
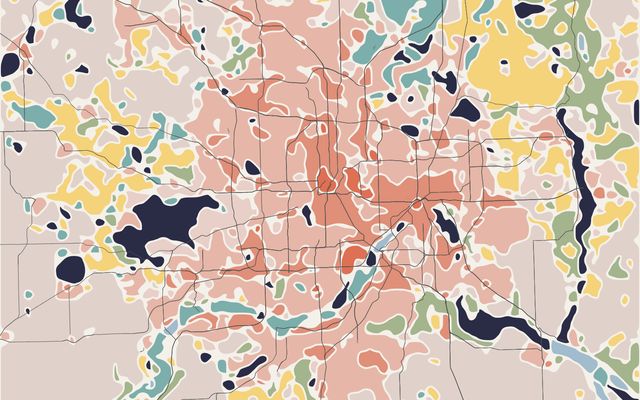
Voronoi labels
Observable
Jun 16
•
2
P-Adic Fractals
nxrix
Jun 13
•
3
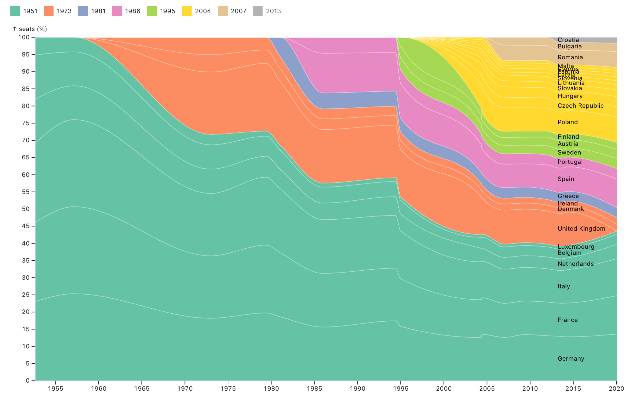
Apportionment of seats in the European Parliament
Observable
Jun 15
•
2
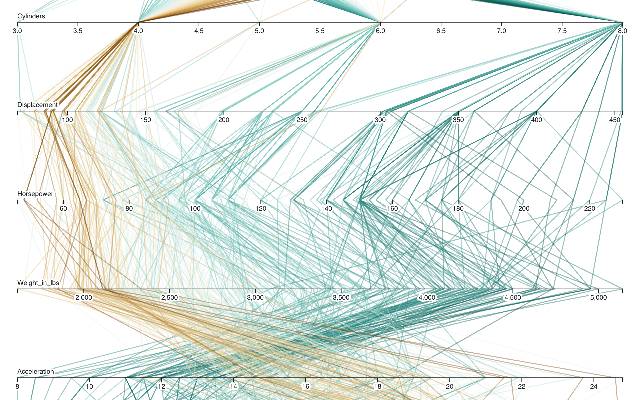
Brushable parallel coordinates
Observable
Jun 12
•
3
Gaussian Prime Spirals
nxrix
Jun 12
•
3
Timer
nxrix
Jun 15
•
2
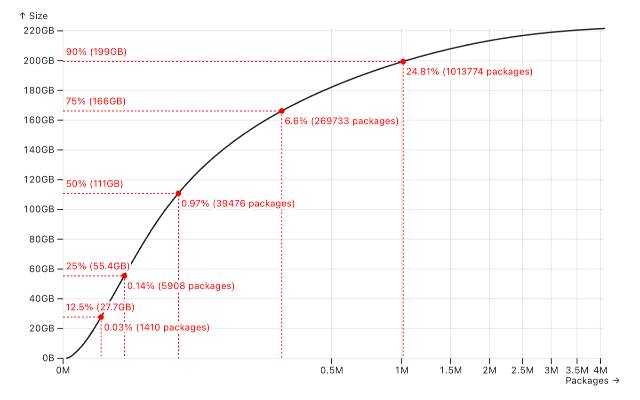
NPM Registry Size
Fabian Iwand
Jun 9
•
3
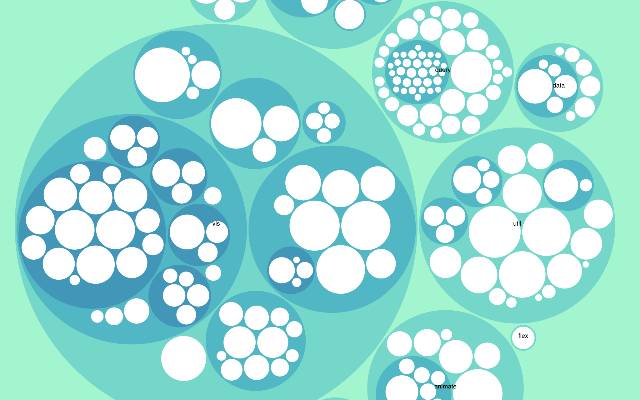
Zoomable circle packing
Observable
Jun 12
•
2
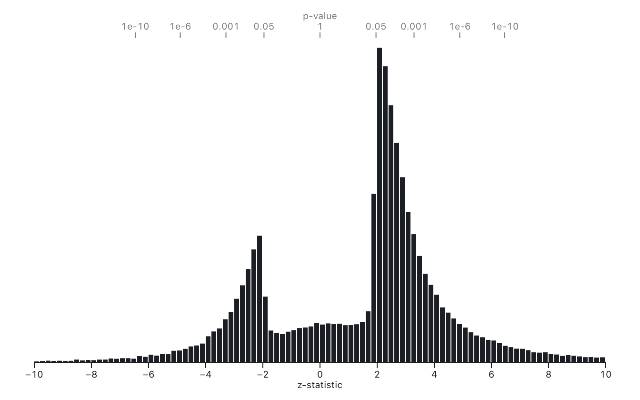
The significance filter
Toph Tucker
Jun 6
•
5
Pixel-8
nxrix
Jun 12
•
2
D3.js Potato Plan
Matt Khinda
May 28
•
11
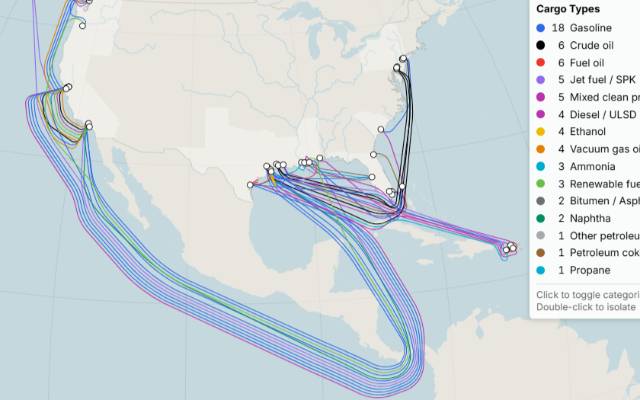
Jones Act Waiver Shipping Dashboard
Cato Institute
May 29
•
10
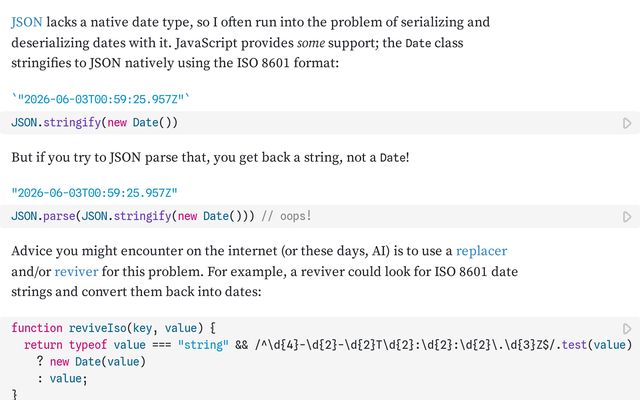
The problem of dates in JSON
Mike Bostock
May 22
•
8
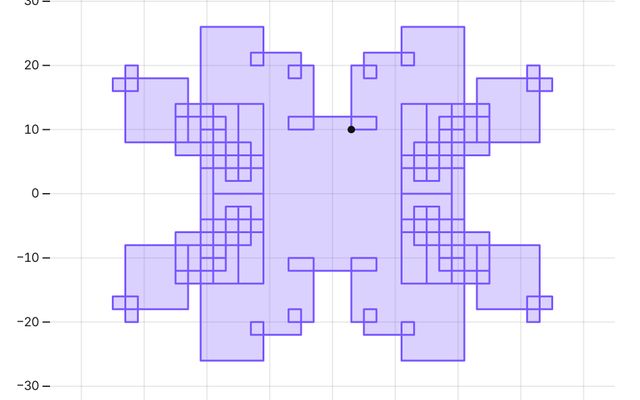
Fractal Merkabah
Lao
May 19
•
5
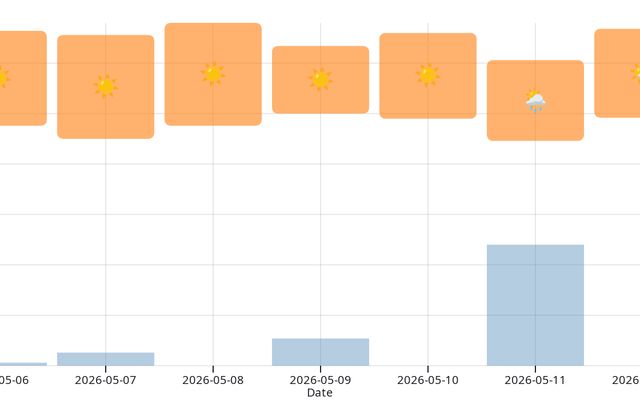
Weather Forecast and Carbon Credit Funding
This notebook is a fork
Ethiopian Adaptation Atlas
May 19
•
4
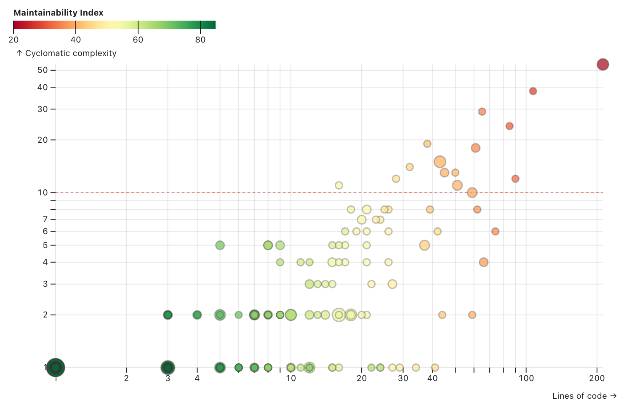
Code Metrics
Tom Larkworthy
May 12
•
5
Showing
31-60
of
72
notebooks
Prev
Next