Exploration without frustration


Spot insights immediately
The hassle-free way to wrangle data
Interactive charts in an instant
Eliminate stakeholder friction
Seamlessly share insights
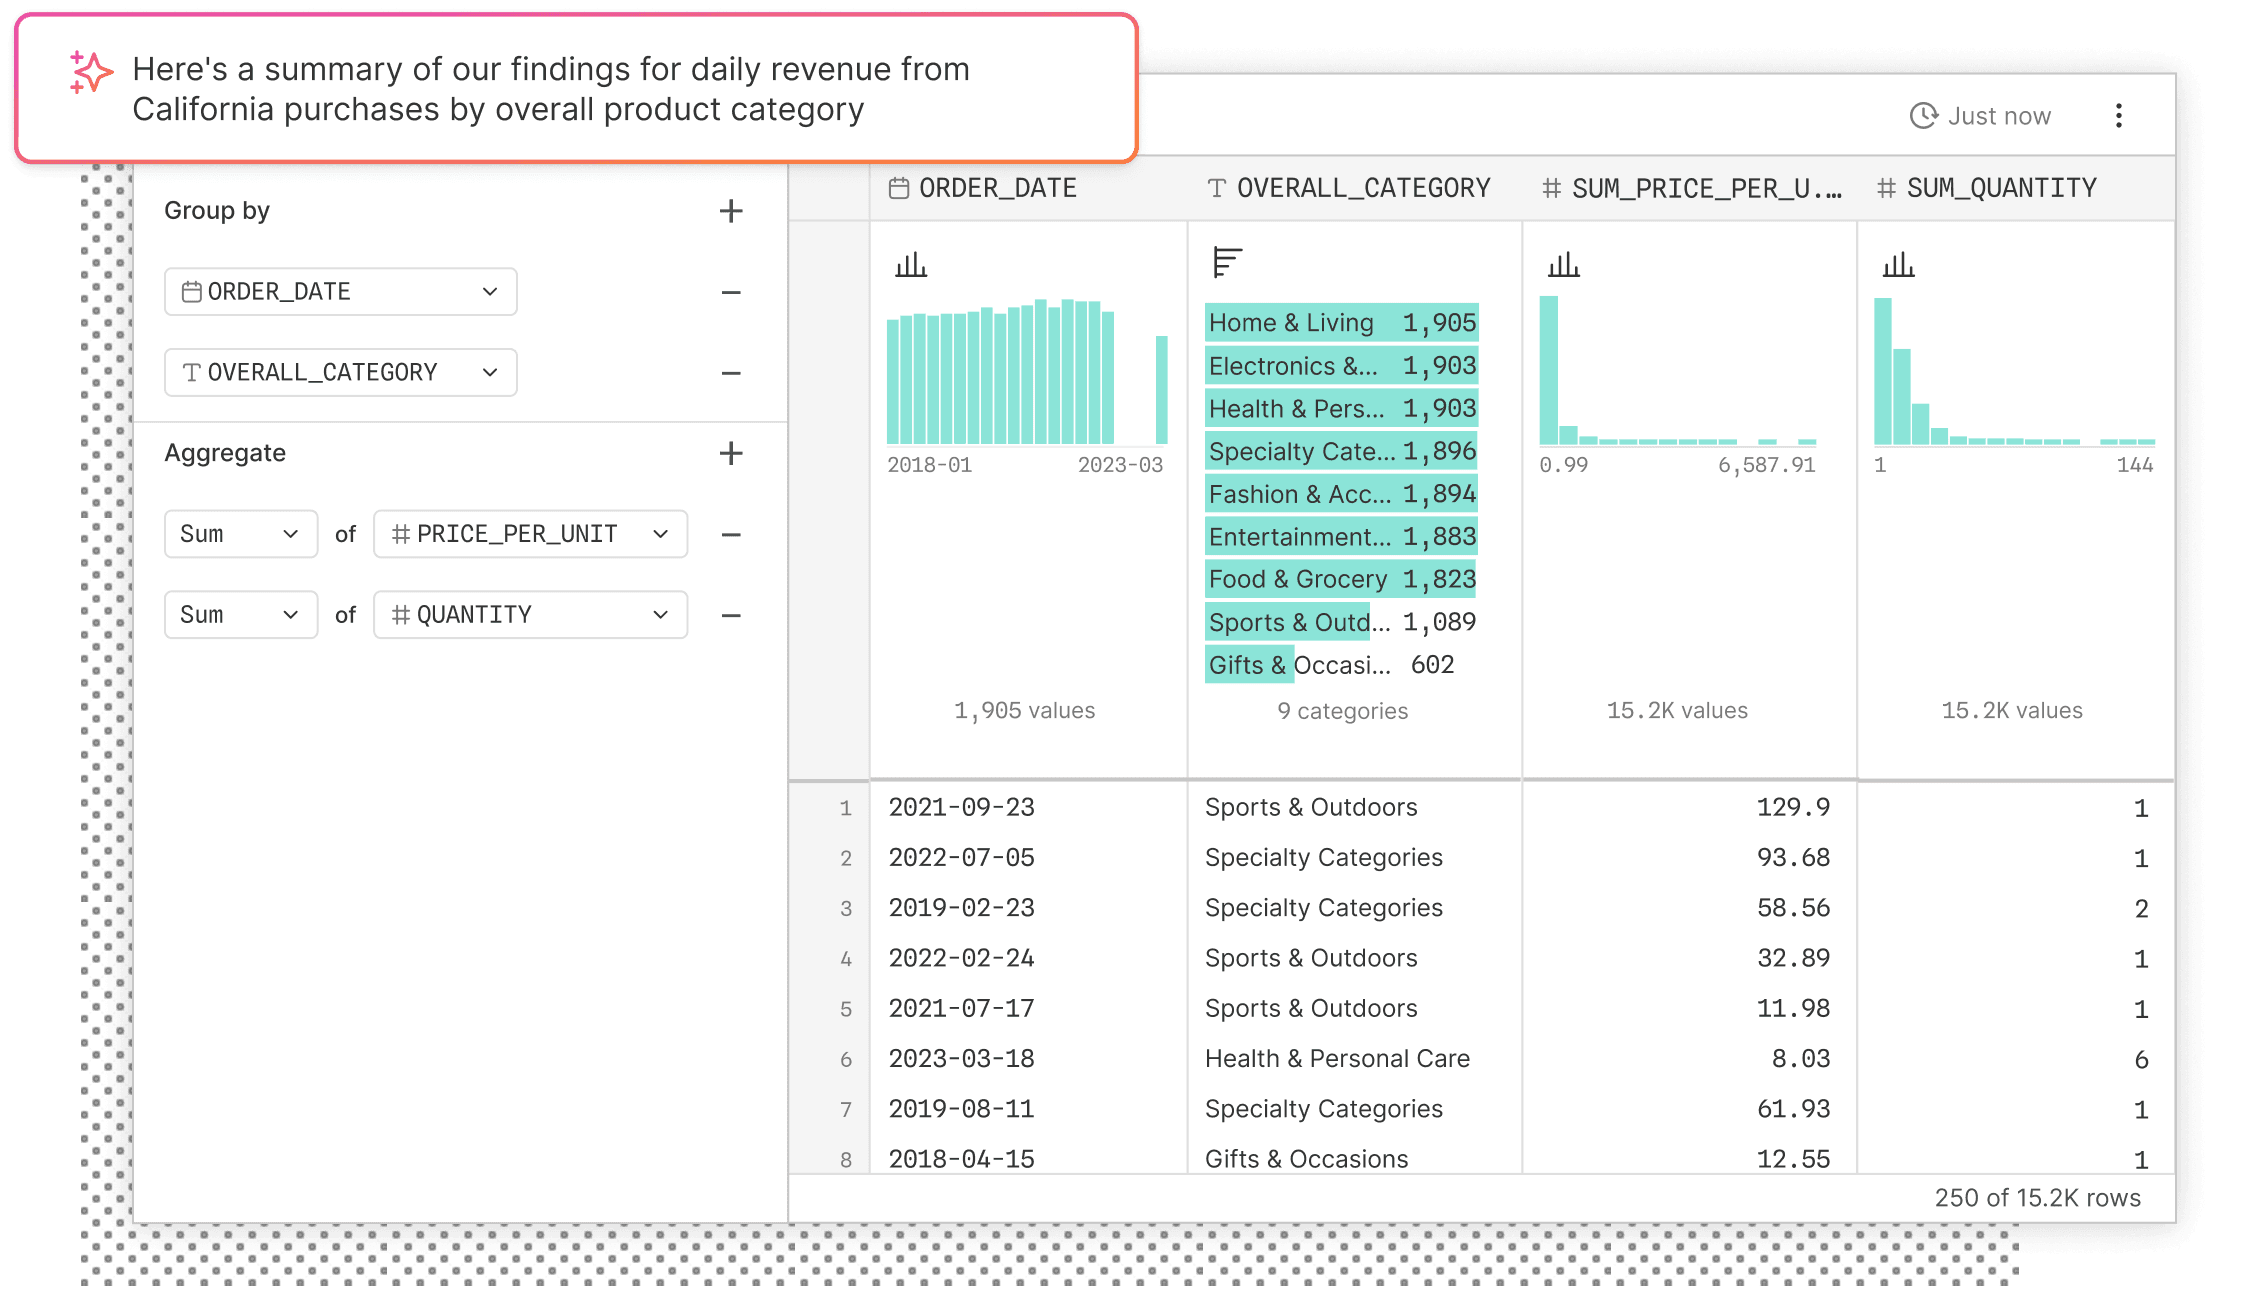
Wrangle
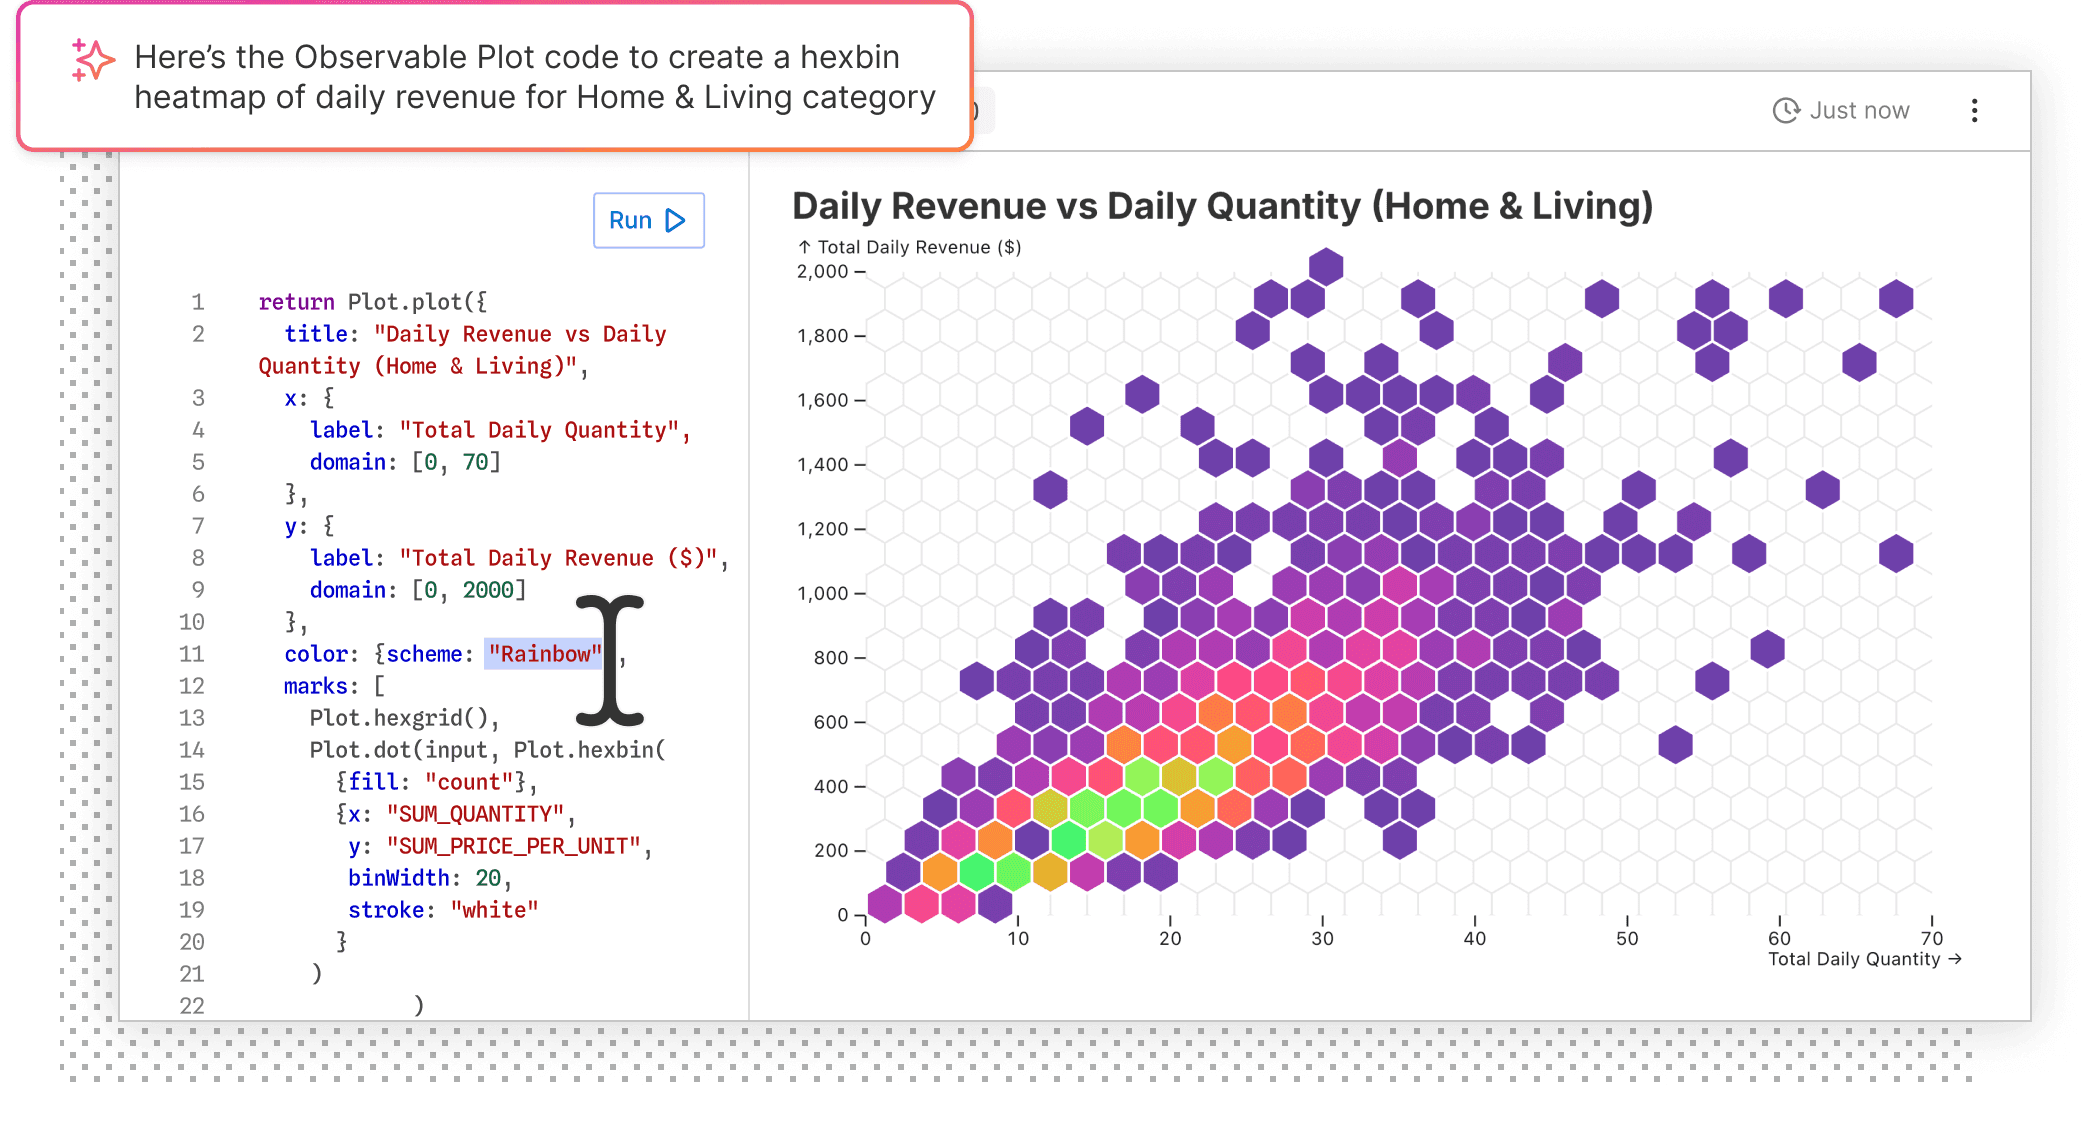
Write code
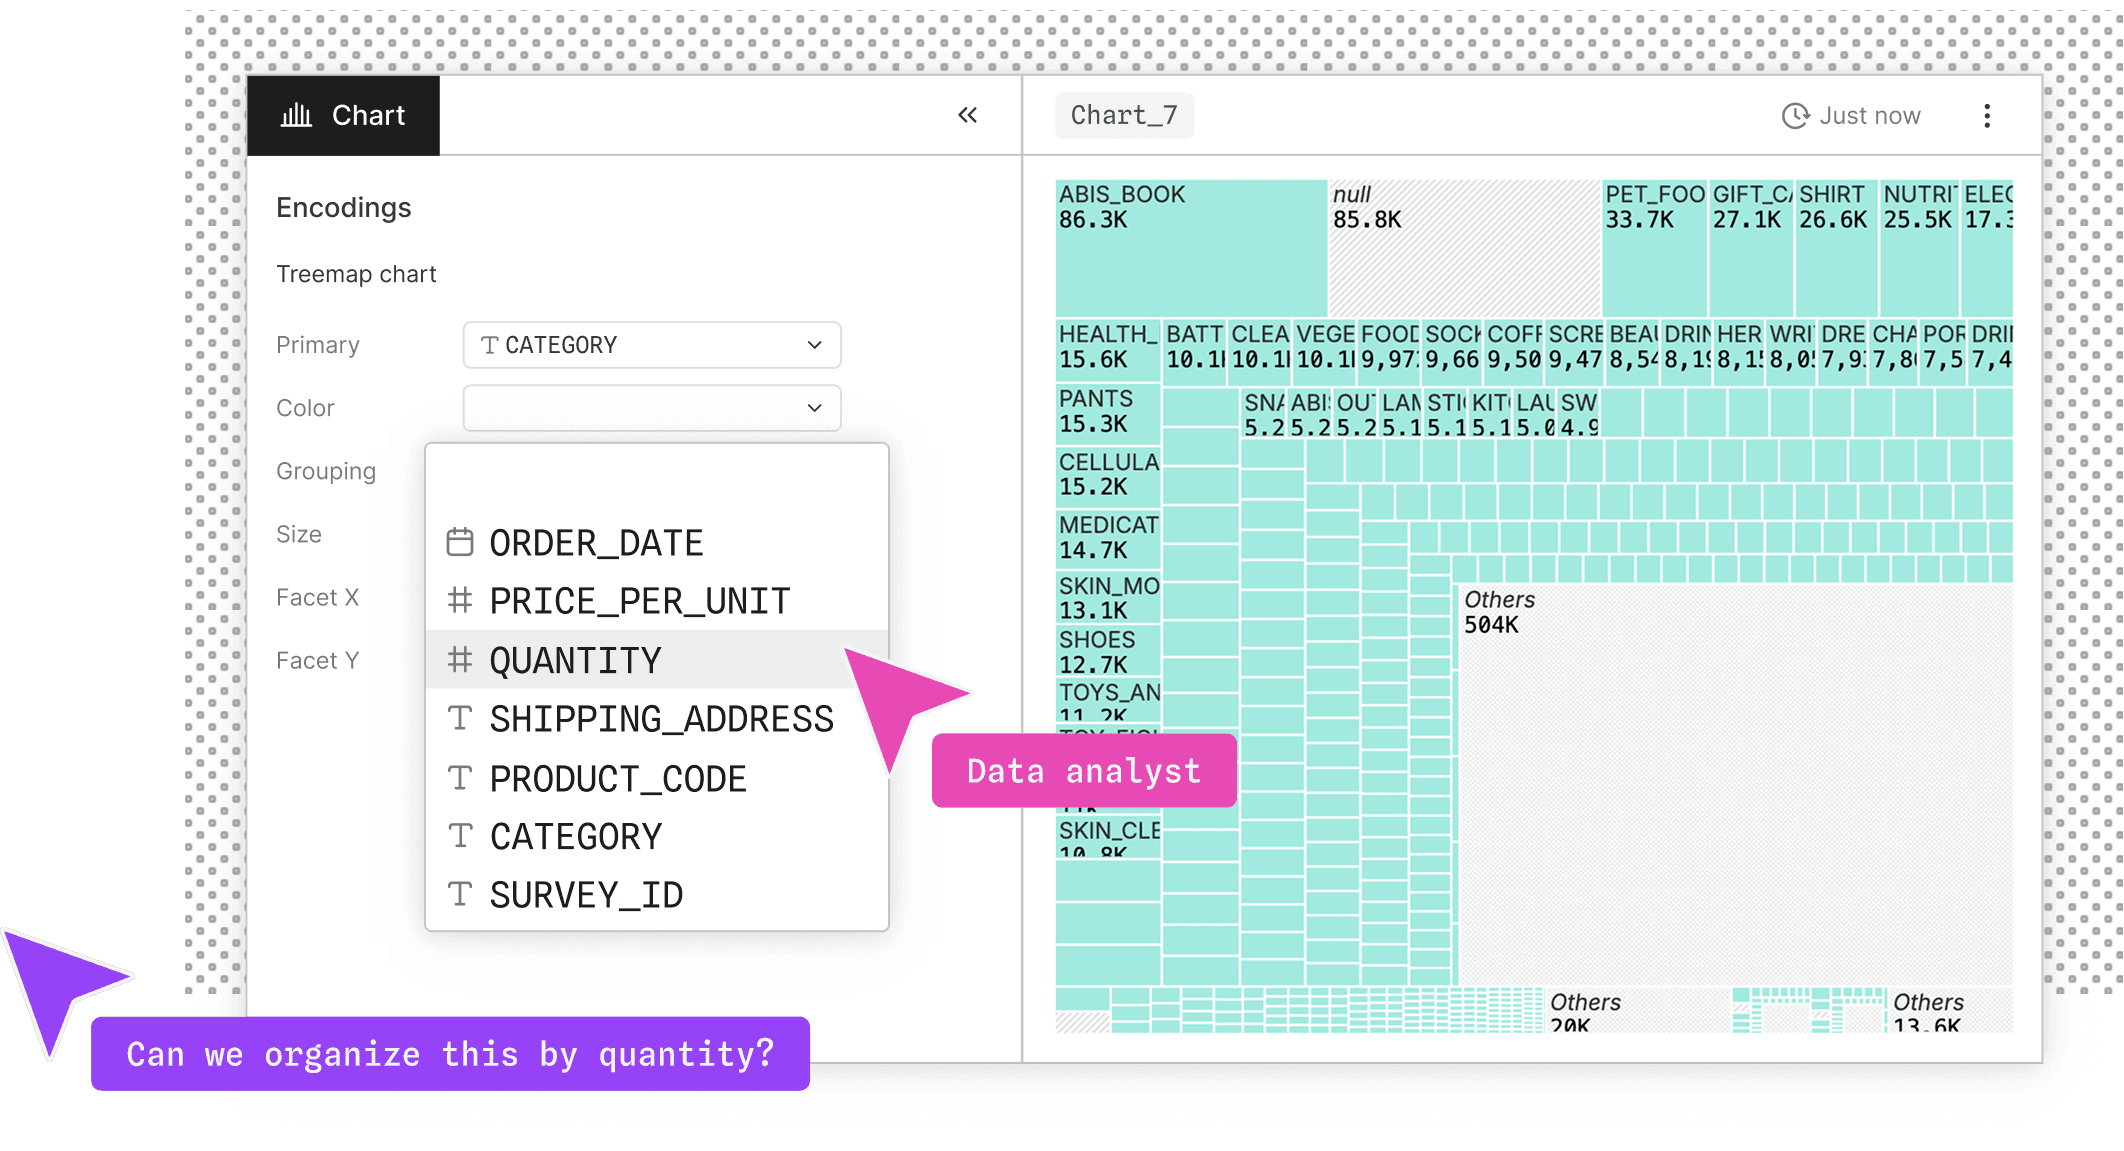
Interact with data
Connect to your database
What people say
What people say
We are in love with @observablehq for all our #dataviz pieces 👩🏻💻
Carmen Torrecillas
I’m getting happy tears every time I see the data files getting regenerated when data loaders change
Youssef A
Getting more into @observablehq. I thought it was a kind of cool but now I realize it’s actually just AMAZING HOLY COW
Victor Powell
If you’re curious about making #dataviz with code but scared of JavaScript, @observablehq is a really great place to start.
Nicole Lillian Mark
An open-ended tool like Observable offers endless opportunities to push the boundaries of what’s possible with our data…
Max Lustyan
Observable opened up this whole new world of what we could offer people on such a short time scale... It expands the type of content we can create, and that we can offer our users.
Katilyn Trudeau
Observable lets us create polished, interactive, insightful visualizations without deep front-end expertise, making it essential for sharing our performance testing insights.
Yao Yue
🤯 This is outstanding work by the Observable team!
Connect data, code, charts, and powerful table components on the fly, visually, and effortlessly. All the piping complexity handled behind the scene. And then throw all that on an infinite multiplayer canvas with free form annotation. I feel like I’m staring at the future of BI!
Thibaut Tiberghien
The UX of AI isn’t an interface, it’s visualizations and simulations. That’s why I’ve been keeping my eye on Observable. And now, their new Data Canvas changes the game, again. It’s all coming together.
Antoine Valot
I use Observable for data dashboards at Tether and it rocks - and now they are out with a new data collaboration product called canvases, and it really rocks
Philip Gradwell
This is really, really incredible stuff. I can't wait to replace a bunch of terrible BI dashboards.
I've seen and used so many amazing in-house dashboarding and reporting tools, and this suite blows them all out of the water.
xyzzy_plugh
Get started today.
Get started today.