The benefits of JavaScript for data analysis
As data goes everywhere, data analysts need a language that can come along for the ride. JavaScript is emerging as the go-to language for data analysis and data visualization due to its ubiquity, compatibility, and robust developer community.
The “data analysis problem" asks: How can we automate basic data analysis and simultaneously empower users to create great analysis? Plenty of tools, like Excel, Tableau, Looker, Qlik, have tried to solve for this.
However, all these tools (and others) have the same problem: creative limitation. You can't fully automate an analysis if you are hamstrung by the ability to customize. And when you have to spend time doing manual updates, you can't focus on doing the great analysis. Unlike traditional data analysis tools that limit customization, using JavaScript allows data analysts to automate basic tasks, build custom visualizations, and share insights widely.
Here are some thoughts on why JavaScript is the future language for data analysts.
#1: JavaScript is ubiquitous, so anyone with a web browser can view your data analysis
JavaScript is the language that is used to power and build the web. It’s ubiquitous.
In Towards Data Science, Observable's Co-Founder and CTO Mike Bostock made this comparison: over the demise of cameras in favor of camera-equipped mobile phones, Photographer Chase Jarvis said, “The best camera is the one that’s with you.” What this means is, your cellphone camera is convenient, and in your pocket, so it’s better than the camera left at home. Similarly, JavaScript is everywhere. Bostock explains:
Because JavaScript is the language of the web, it runs everywhere. Like the camera phone in your pocket, nearly everyone has a browser that runs JavaScript — the very browser you’re using to read this article. JavaScript enables interactive visualizations, explorable explanations, live analyses, model simulations, computational art, games, quizzes, you name it. When someone shares an analysis implemented in JavaScript, you’re not just seeing a static snapshot of their work; you’re running it live in your browser. You can go beyond passive reading by querying data, tweaking assumptions, and asking questions.
#2: JavaScript enables data analysis in a universal language
JavaScript's widespread adoption makes it the universal language for data analysis.That means that it’s easy for anyone who is familiar with JavaScript to get your analysis up and running on their laptop, tablet, or phone. It’s a language that is built for sharing, with no local installation required. And if you have a browser, you have JavaScript.
The image below is pulled from Observable notebook above, Visualizing Air Raid Sirens in Ukraine, was created by Volodymyr Agafonkin.
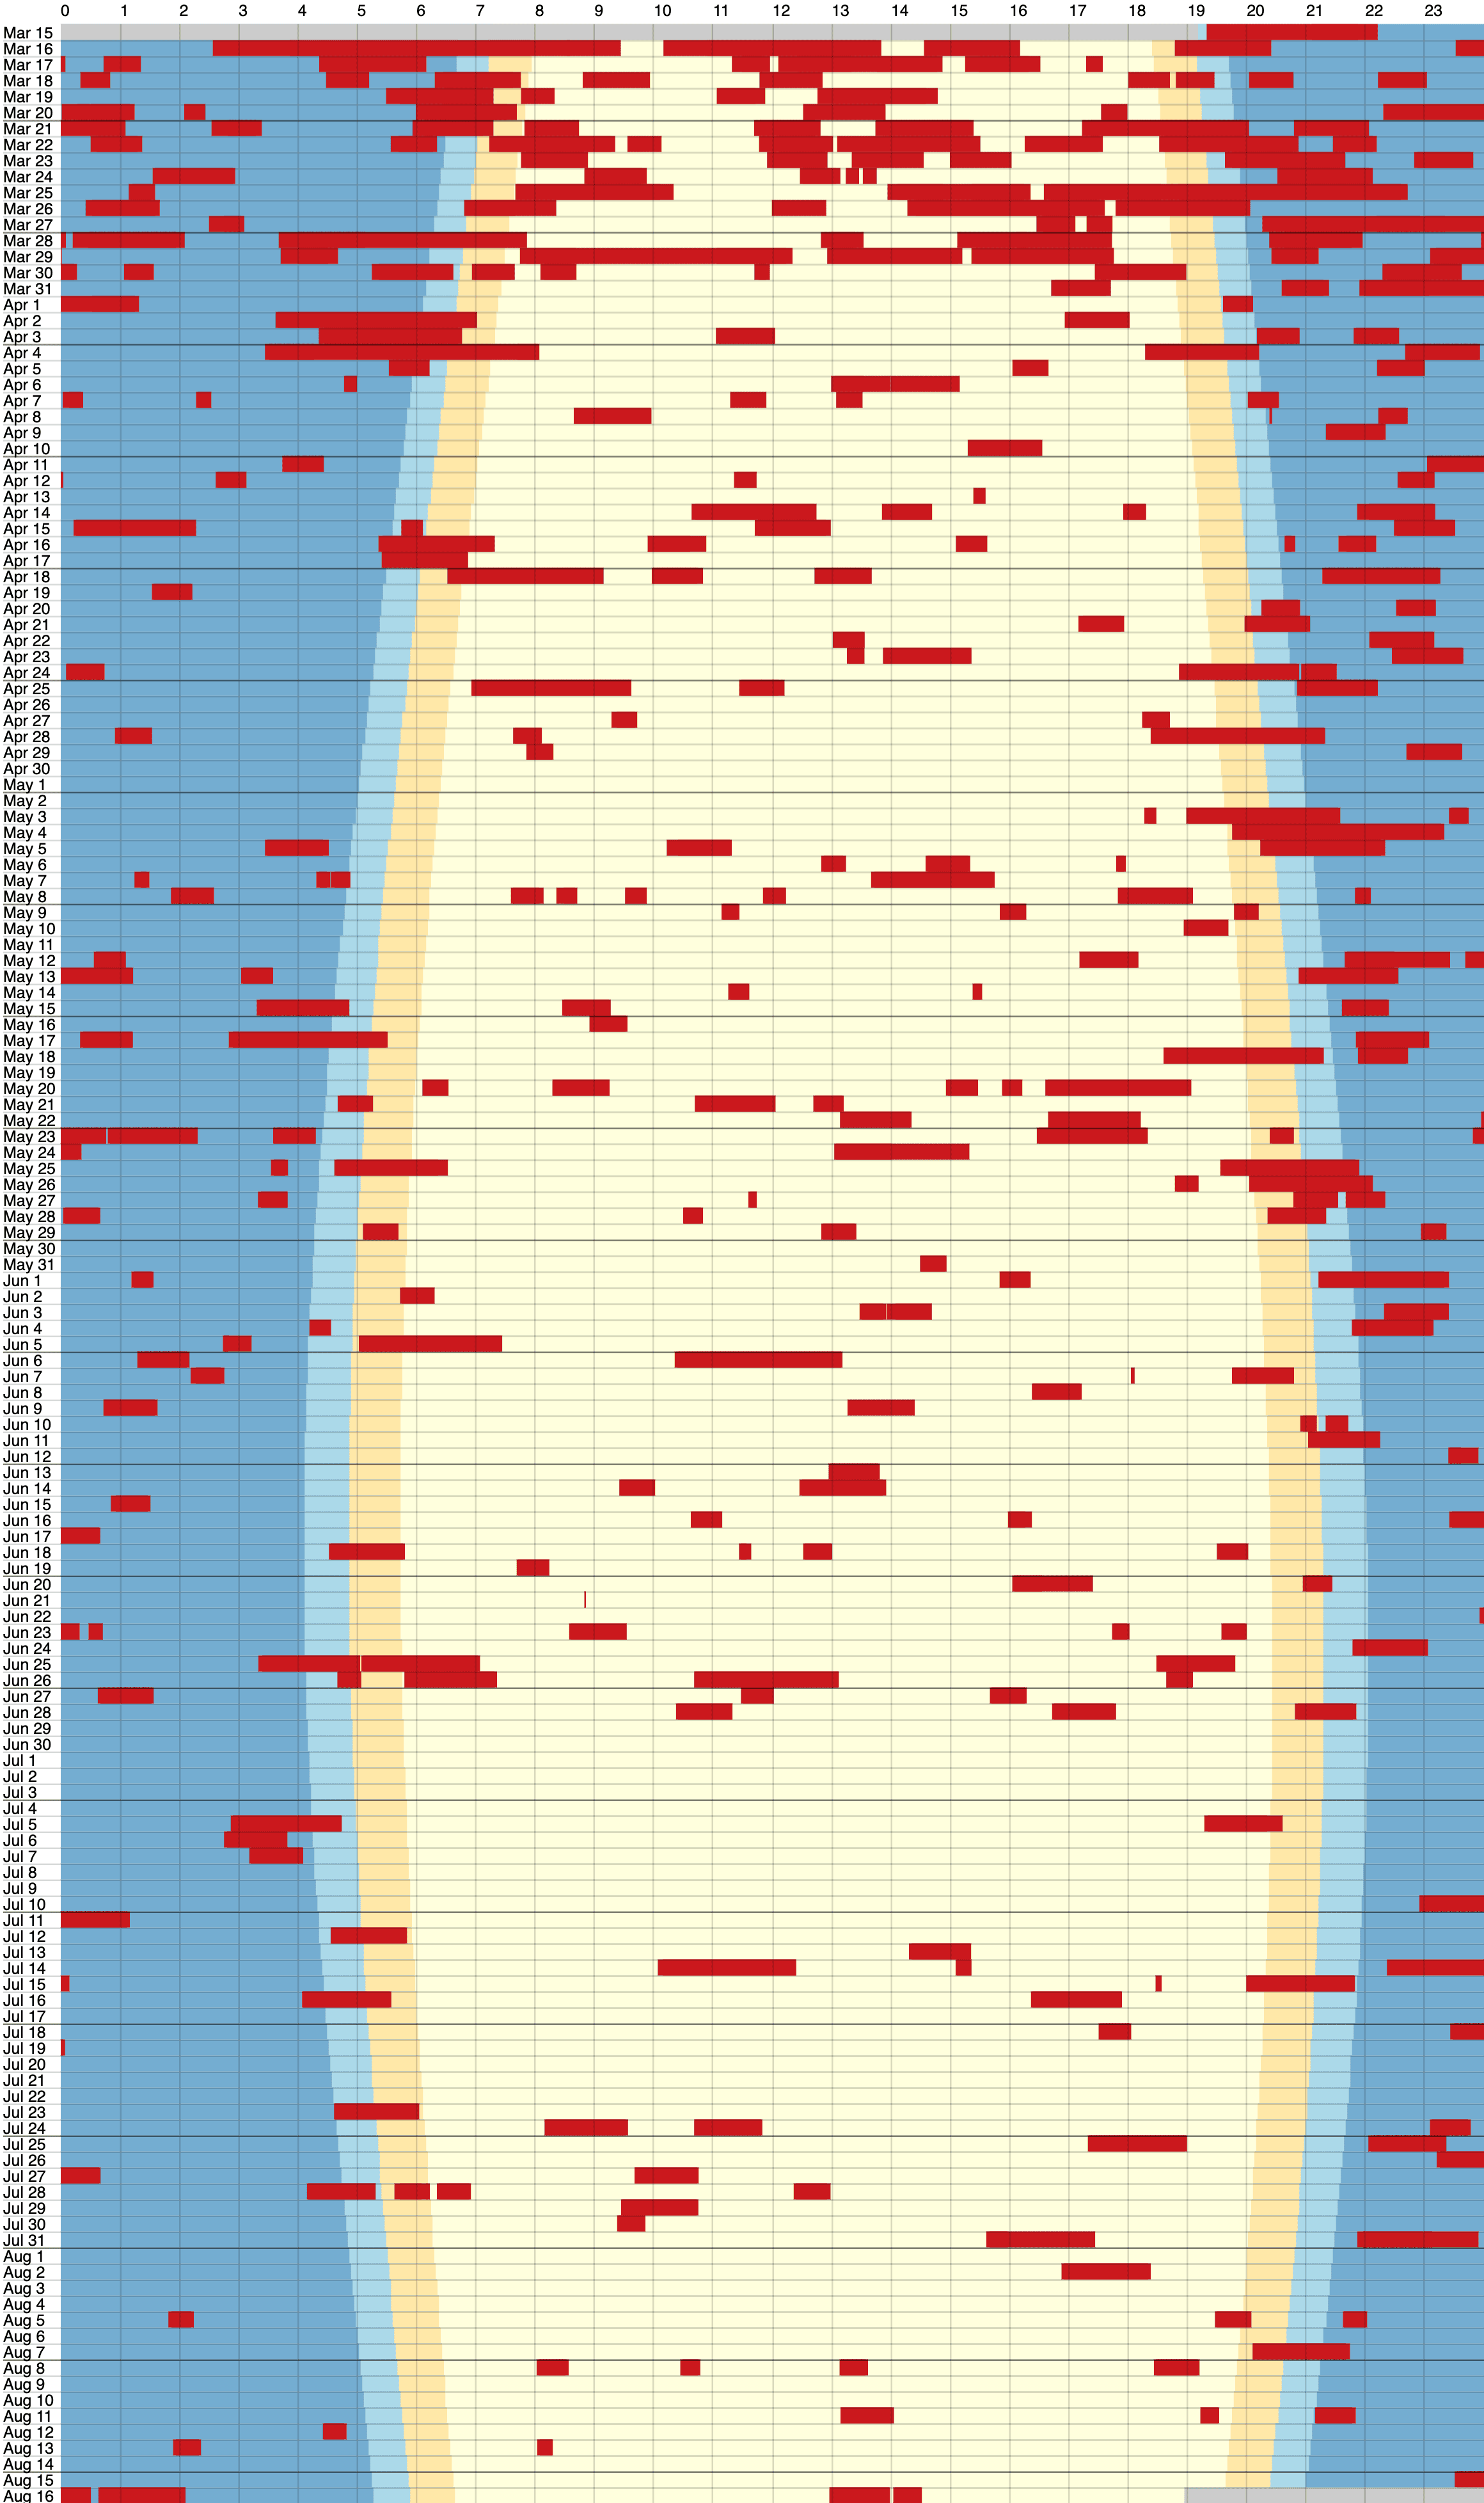
In this example, the benefits of using JavaScript for his data analysis were many. He was able to do all his data work in one place: the analysis, visualization, and presentation. In addition, he was able to share it out, to embed it anywhere, seamlessly.
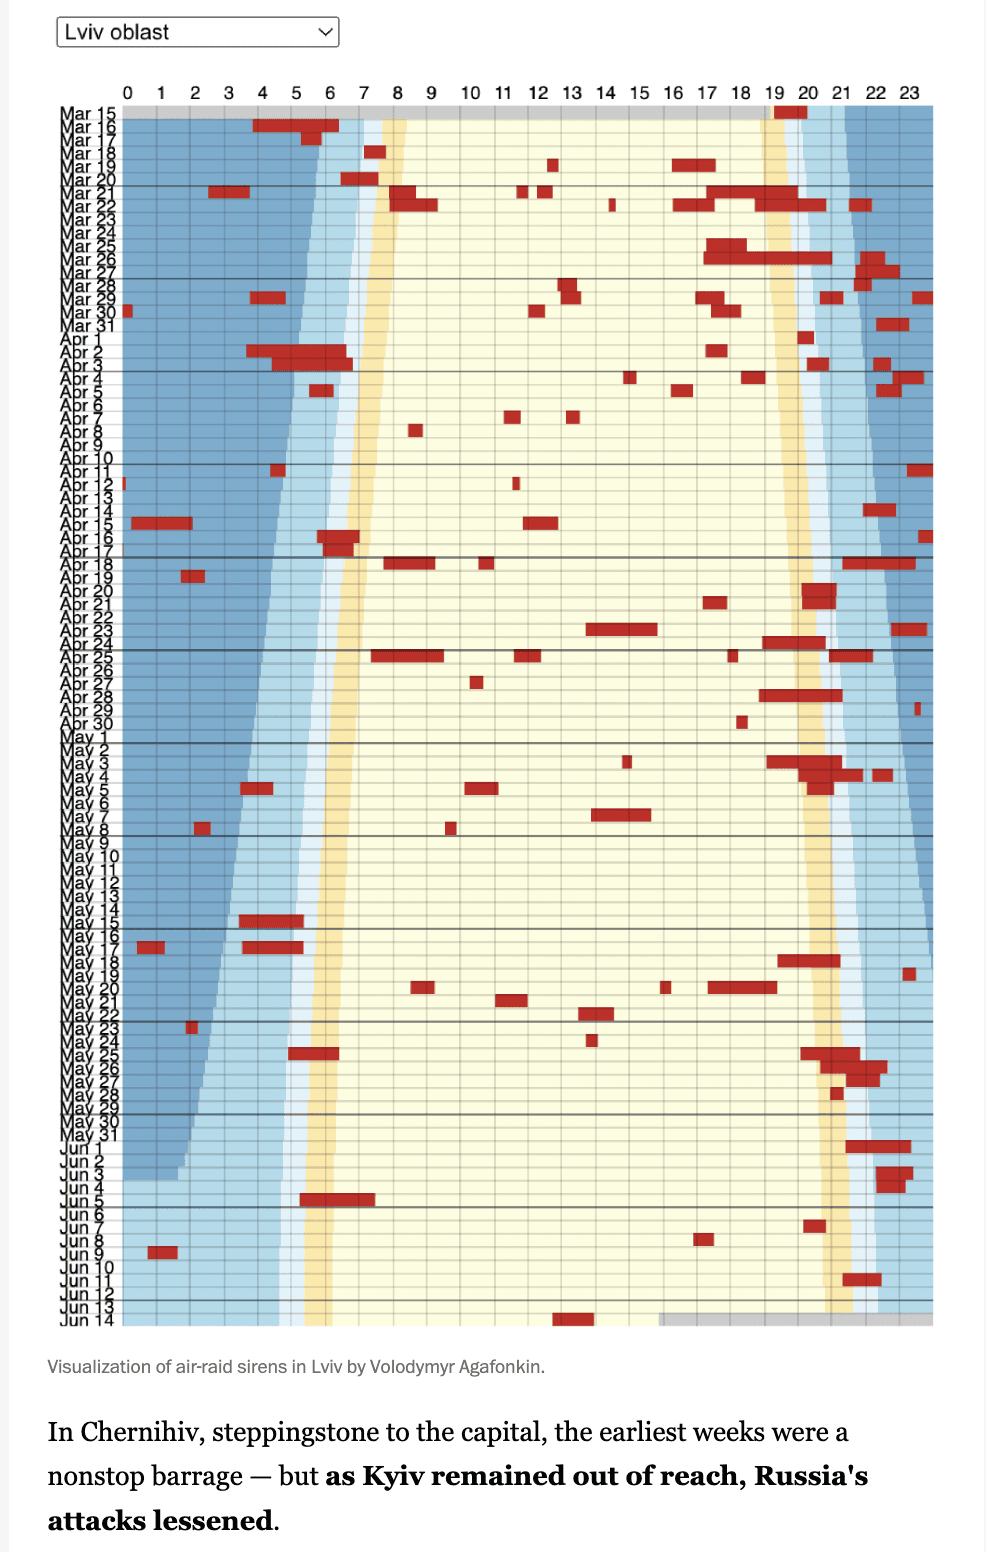
In fact, his notebook ended up being featured in the Washington Post newsletter entitled How To Read This Chart. The image below was pulled from that newsletter. Columnist Philip Bump used Agafonkin’s notebook to create and embed several unique visualizations in his article. Which leads us to the third way JavaScript makes data analysis faster and easier.
# 3: JavaScript lets you embed your data analysis anywhere
One of the standout benefits of using JavaScript for data analysis is its ability to embed interactive visualizations directly onto front-end applications (what any user sees and interacts with on a website). This allows you to reach a broader audience, and have more impact. For example, in a JavaScript-based tool like Observable, you can import, clean, and explore your data. Then, in that same platform, you can use ready-made snippets (for JavaScript novices) or code in JavaScript itself (for those who are fluent) to create your visualizations.
Doing data analysis in JavaScript allows you to quickly share your results where your users are: in the browser. And an added benefit when you’re working in the platform you’re also sharing, changes you make to your work appear live to your user, so no more “please open this fixed version of the report” emails. Where your users go, they will see the latest and greatest. For example, in a JavaScript-based tool like Observable, you can do all your analysis work in the browser and when you’re ready to share, embed the analysis in any website with a simple HTML iframe. Did you forget to filter the outliers in your dataset? No problem, just update the analysis and your new work will be immediately live to your users. Does someone want to feature your great analysis on their blog? Great, you can share with them the same embed link and your work gets in front of more people with no additional cost.
The image below shows Volodomir's embedded analysis in a Washington Post newsletter. By building visualizations with JavaScript, you can ensure your analysis is easily accessible and viewable to your audience.
#4: Accelerate data analysis with extensive JavaScript libraries
JavaScript offers a wealth of pre-written libraries and modules that streamline data analysis and visualization development. Libraries such as D3.js, Vega, and Highcharts have set the standard for web-based data visualization.
With thousands of modules available via NPM, you can quickly integrate advanced data analysis and visualization functions into your projects.
JavaScript visualization libraries that are open-source, well maintained, and incredibly extensive. And that’s why you’re seeing more and more JavaScript libraries designed for data analysis and data science – analysts, developers, data scientists would rather work in one language, than analyze data in Python and develop data visualizations in JavaScript.
To get started with a data analysis and visualization tool that uses JavaScript (as well as SQL, snippets, and more), try Observable for free.