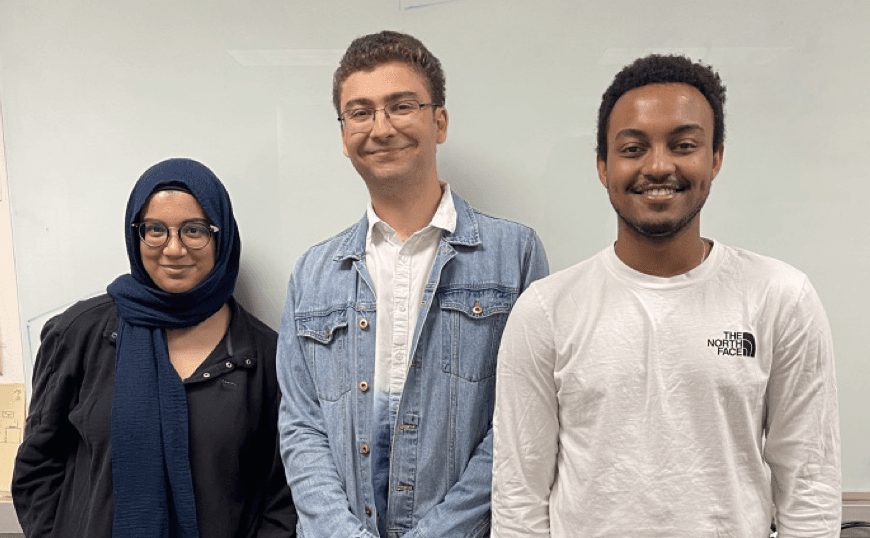
From left to right: Nora Khokhar, Dylan Green, and Naol Tulu of UC Irvine. Photo Courtesy of Dylan Green
Observable has always been focused on the future of data visualization, and who better to amplify the literal future than students?
This October, Observable hosted a Data Jam. Student teams had a week to explore data and discover new insights. We wanted to give students an opportunity to practice building data narratives for broad audiences.
The winning team demonstrated Observable's guiding principles: responsible data practice, the power of collaboration, and contributions from diverse practitioners.
The winners, Team Koi Pond, hail from UC Irvine and include Dylan Green, Nora (Tasneem) Khokhar, and Naol Tulu. This team excelled in data analysis, storytelling, appropriate context-setting, and presenting their work.
Our judges, Allison Horst and Ian Johnson noted that a competing team was inspired by code Koi Pond had developed, and gave the team credit for creating features that others found useful.
Horst said, "Another standout features of their submission was that they included a bonus data set. They not only accounted for accessibility in their color palette, but linked to research that informed their decision."
Read on, as Koi Pond shares their experience as a team collaborating on Observable.
How did your team's skills come together when assembling your notebook?
Tasneem Khokhar: We all are from a physics background. Naol and I are undergrads and Dylan is a graduate student. Physics in general requires us to be able to problem solve and analyze data in our everyday vigor. Dylan's knowledge of Javascript combined with our input of mathematics and data analysis led to our completion of our notebook.
Naol Tulu: We decided early on in the competition to split the work up into sections, instead of working on the same parts together. Dylan had the most experience when it came to Javascript. The majority of the work was the math we used to model the distributions. Dylan was also advising Nora and I on the parts that we were handling.
Thanks to our backgrounds in physics, Nora and I both had some experience when it came to both the probabilistic models and programming. With some guidance from Dylan we were able to do a significant amount of the calculations needed for the models, as well as extracting the data from the data set.
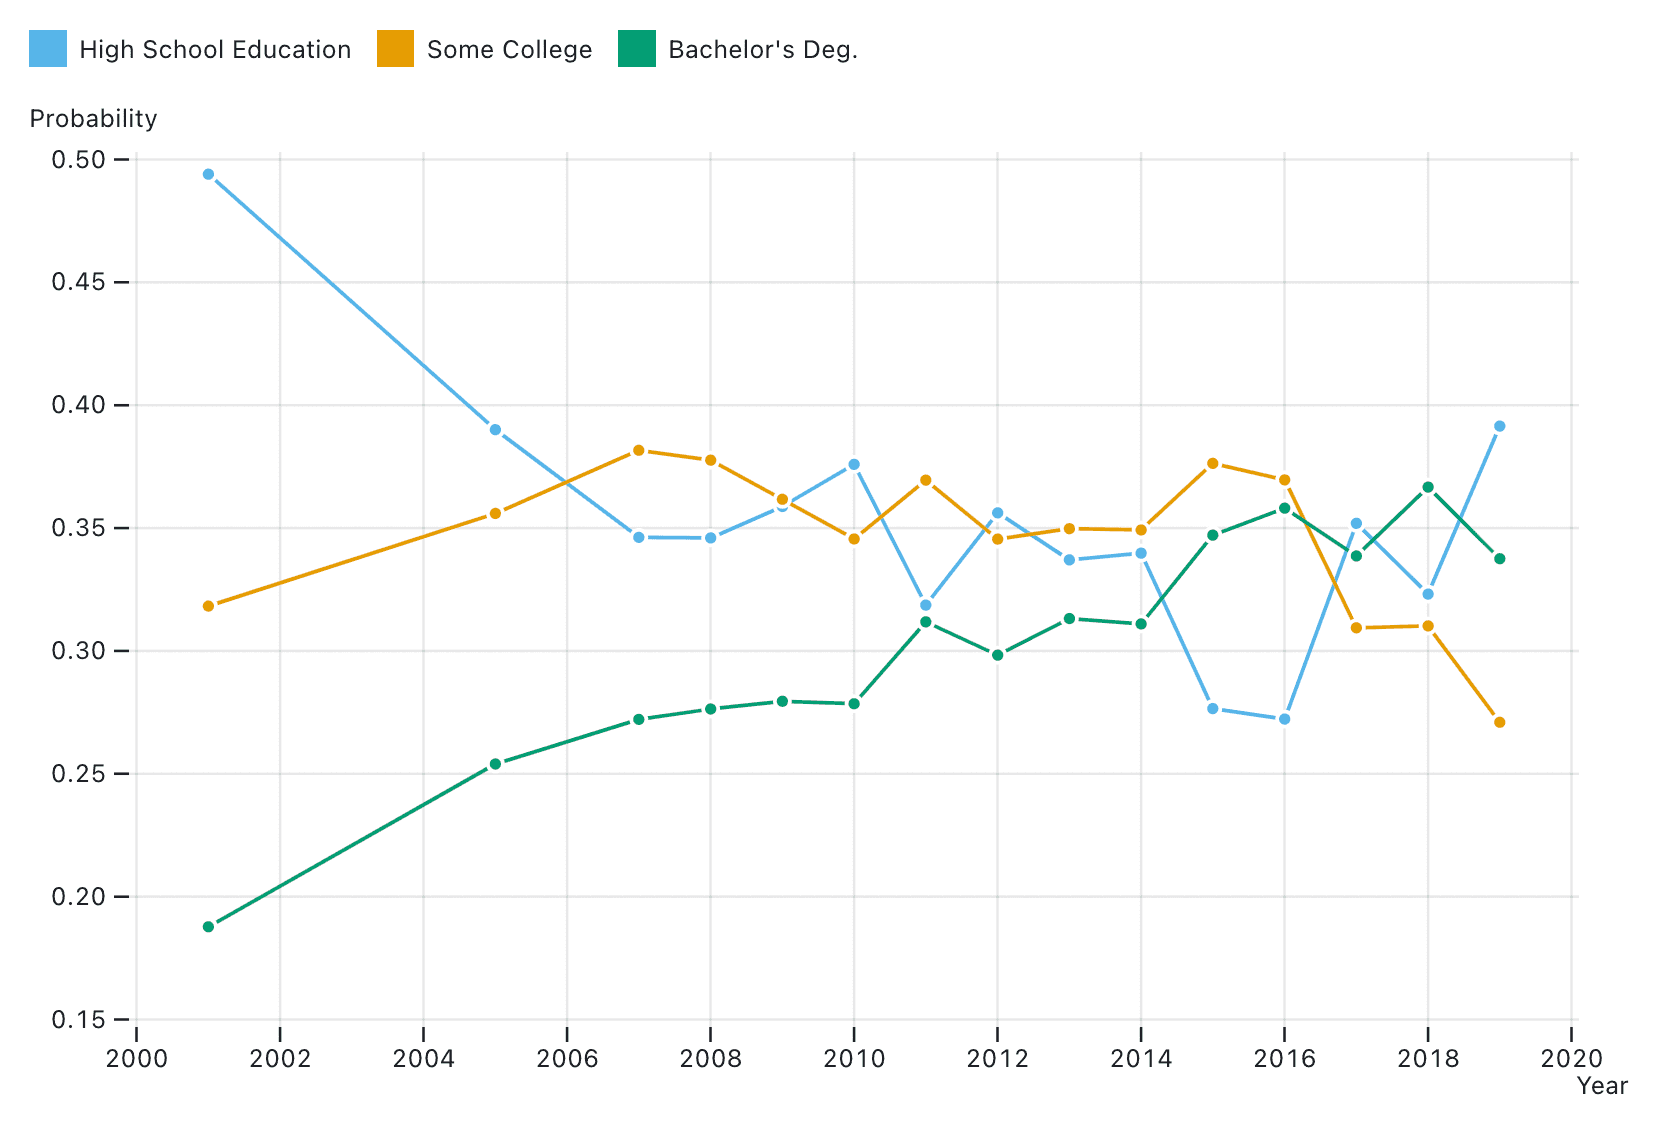
A Plot from Koi Pond's winning notebook
What aspects of Observable helped your team?
Dylan Green: One of the aspects of Observable that I found helpful was the interactivity and the way the notebook automatically updates with each change. I wrote a function that could get enrollment data by demographic group, for example, but the initial version did not depend on year.
That way, I could make sure that everything depending on that function worked, and then later went back and added the year dependence into the function, which automatically propagated to everywhere that used that data.
“We had a bit of an a-ha moment early on, when we realized we were given data at multiple time points in a prototypical person’s career ... The story we wanted to tell started there, and once we had that laid out everything else started to fall into place.” —Dylan Green, Team Koi Pond, Observable Data Jam Winner 2022
What was the most surprising or intense part of your experience? What a-ha moments did you have with the data?
Dylan Green: Certainly the most intense part was the final push to the finish line. In the last hour of the competition we had one last feature of our model we wanted to express and code up, but ran into a bug with about 15 minutes to go.
We ended up having to rush through a fix for it that ended up being somewhat of a hack, but it worked. In hindsight, there was definitely an easier way to do what we were writing up at the end, but when you’re on a time crunch like that, you just commit to the first idea you come up with.
We had a bit of an a-ha moment early on, when we realized we were given data at multiple time points in a prototypical person’s career. That is, we were given enrollment data, then graduation data, and then master/post graduate degree data. The story we wanted to tell started there, with that realization, and once we had that laid out, everything else started to fall into place.
What features did you use to dig into the data? To express it?
Dylan Green: The challenge notebook provided included a useful visualization that we explored quite thoroughly before digging into the data further in order to build our model. We very extensively made use of the dropdown feature and the ability to code variables to be interactive and end-user modifiable, to explore the dataset, since it was so vast and at times intractable.
Did you do anything differently knowing teams' notebooks were public during the competition?
Dylan Green: I wouldn’t necessarily say we did anything differently knowing that notebooks were public. We worked directly in our notebook for everyone to see. Although, I did keep a tab open with all public forks of the challenge notebook, so I could keep an eye on what our competitors were doing during the challenge.
A Plot from Koi Pond's winning notebook
Looking forward with gratitude
The Observable team is hosting another Data Jam in the spring of 2023. We hope our teams can capture the same high-quality visualizations and collaborative spirit that our first winners achieved.
We're grateful to have such a fantastic team for our first student-driven event. The students from UC Irvine brought a wonderful mix of analysis and storytelling to help us understand how new and interesting conclusions can emerge when teams work together on Observable.
Check out the winning notebook for yourself!
Watch this 15-minute presentation from Koi Pond, live at the Observable Insight community conference in October 2022.
The team was also featured in the UC Irvine Official Campus Newspaper.