Visualizing data is more important than ever
There are ~56M+ developers on GitHub and growing.
As more developers collaborate, complexity increases. It’s easy for technical matters to consume all our attention, but are we asking the right questions?
Is this the right data to be looking at?
What are we trying to understand?
How to we stay focused on insight? On thinking?
How do we - all of us - shift our behavior in order to find answers together?
Visualizing data is ONE of the ways we find answers together. Visualization helps us be smarter developers by exposing underlying data and code to allow us to question, explore, and derive new insights.
At Observable, we’ve been inspired by our open community: code sharing and open collaboration are the norm for great software. And because GitHub is the largest developer platform in the world - where the world builds software - Observable is excited to share how GitHub users find answers through visualization. GitHub users can connect with their Github accounts, get started with community examples, use one of the GitHub templates, work directly with the API and collaborate with other GitHub users on Observable.
Get started with a GitHub PR template
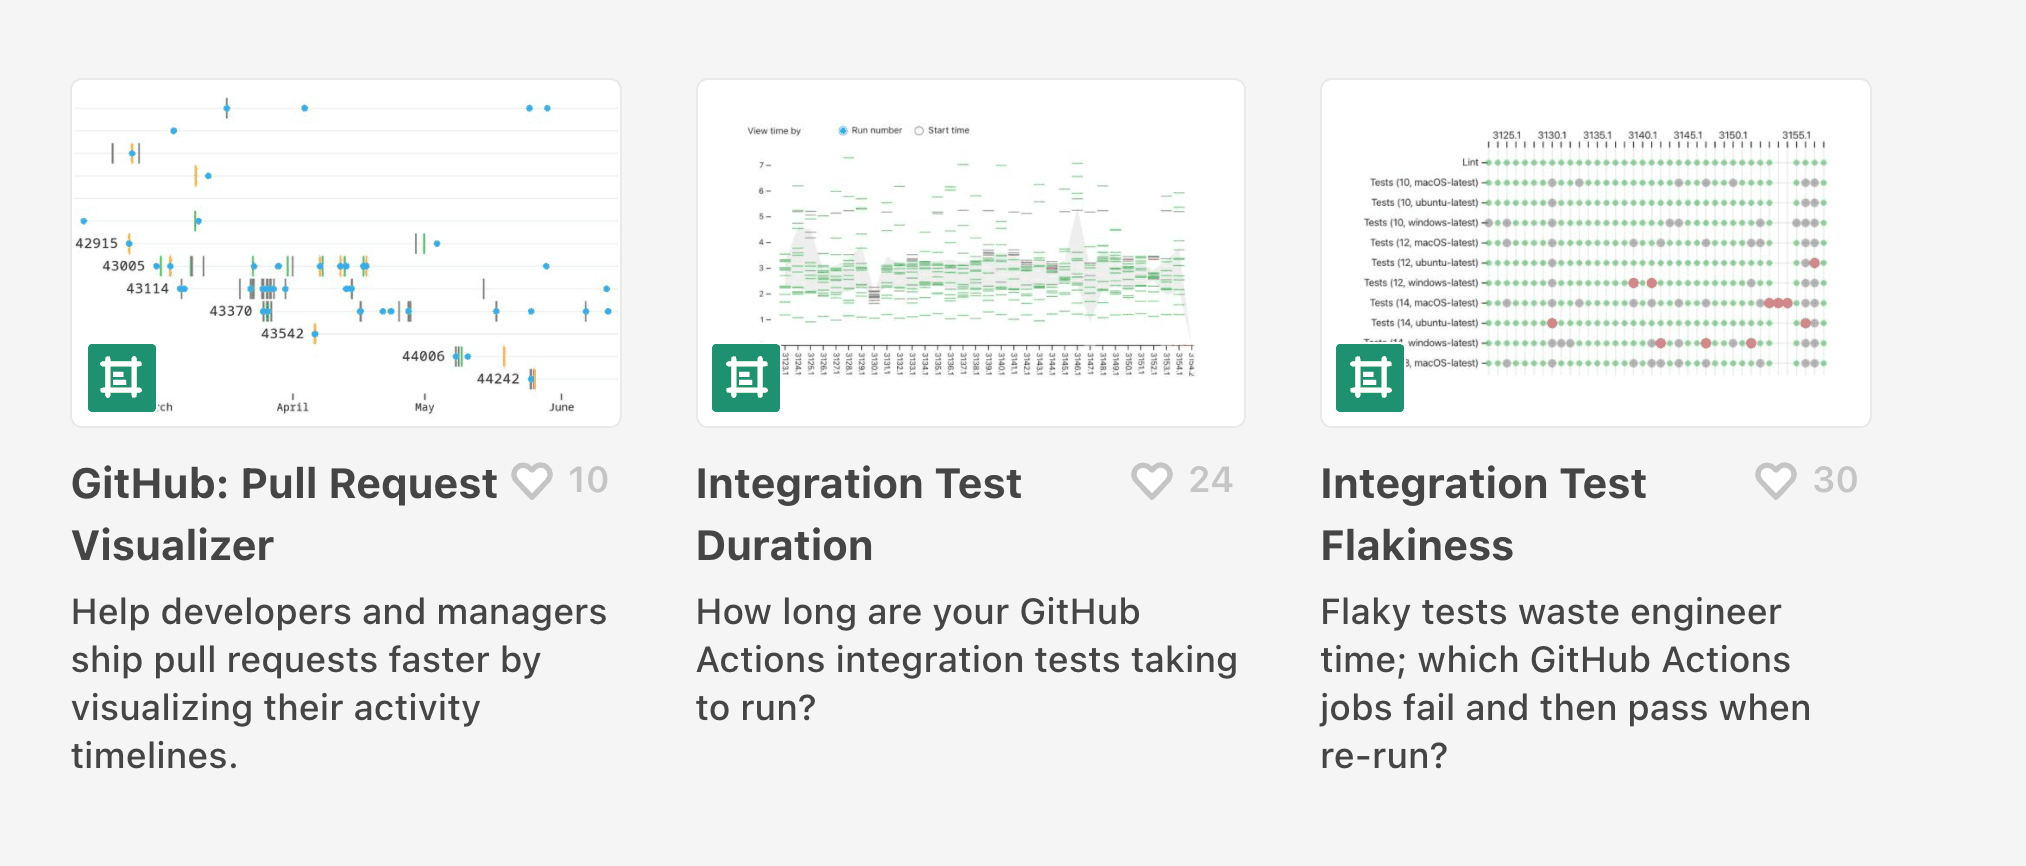
Pull requests (PRs) are the heartbeat of any repo. They are how new features get delivered to users, how bugs are fixed, and how performance is improved. Octoverse suggests small PRs drive productivity (better reviews, faster feedback). Observable has created the following templates with this in mind.
GitHub Pull Request Visualizer: This template helps developers and their teams ship PRs faster.
Visualize the activity timelines of PRs, which makes it easy to identify PRs that may require help in order to ship.
Correlate activity timelines with a simple metric of reviewer load - it's possible that the needed help might simply be finding an alternate reviewer who has less on their plate!
GitHub suggested reviewers: GitHub's pull request interface helpfully suggests reviewers based on recent changes to the files included in the pull request.
Observable's template provides more context to the suggested reviewers by showing who has made the most recent commits across the relevant files, and when or where (in which file) they made each change.
The template also helps you determine the most suitable reviewers, as well as their respective areas of expertise.
GitHub integration test templates
Automation drives productivity - reducing toil and releasing faster. Octoverse wisely recommends investments in automation. Testing is an important part of the deployment process. Think CI/CD and frequent deployments for the win. Observable has templates that can help.
Integration test duration. This template shows how long your integration tests are taking to run, so you can see which jobs take the longest, and how the duration has changed over time.
Integration test flakiness. This template helps you quickly identify which jobs in your GitHub Actions are flaky and re-running. Flaky tests can be a headache, subtly but constantly wasting engineering time.
Use the GitHub API directly
If you don't want to get started with a template, you can use the GitHub API directly from your notebook.
GitHub API Starter is a great place to get started. This notebook walks through how to connect using the API. To deepen your understanding, you can traverse the GitHub API using the explorer.
If you are looking for more help, you can find examples in the GitHub API helper notebook.
Use your GitHub account on Observable
You can easily log in to Observable using your GitHub account. At sign-up, select "Continue with GitHub" and you will be prompted to enter your GitHub account.
Now that you are ready to go, you can participate in the community visualizing GitHub data.
A community visualizing GitHub data
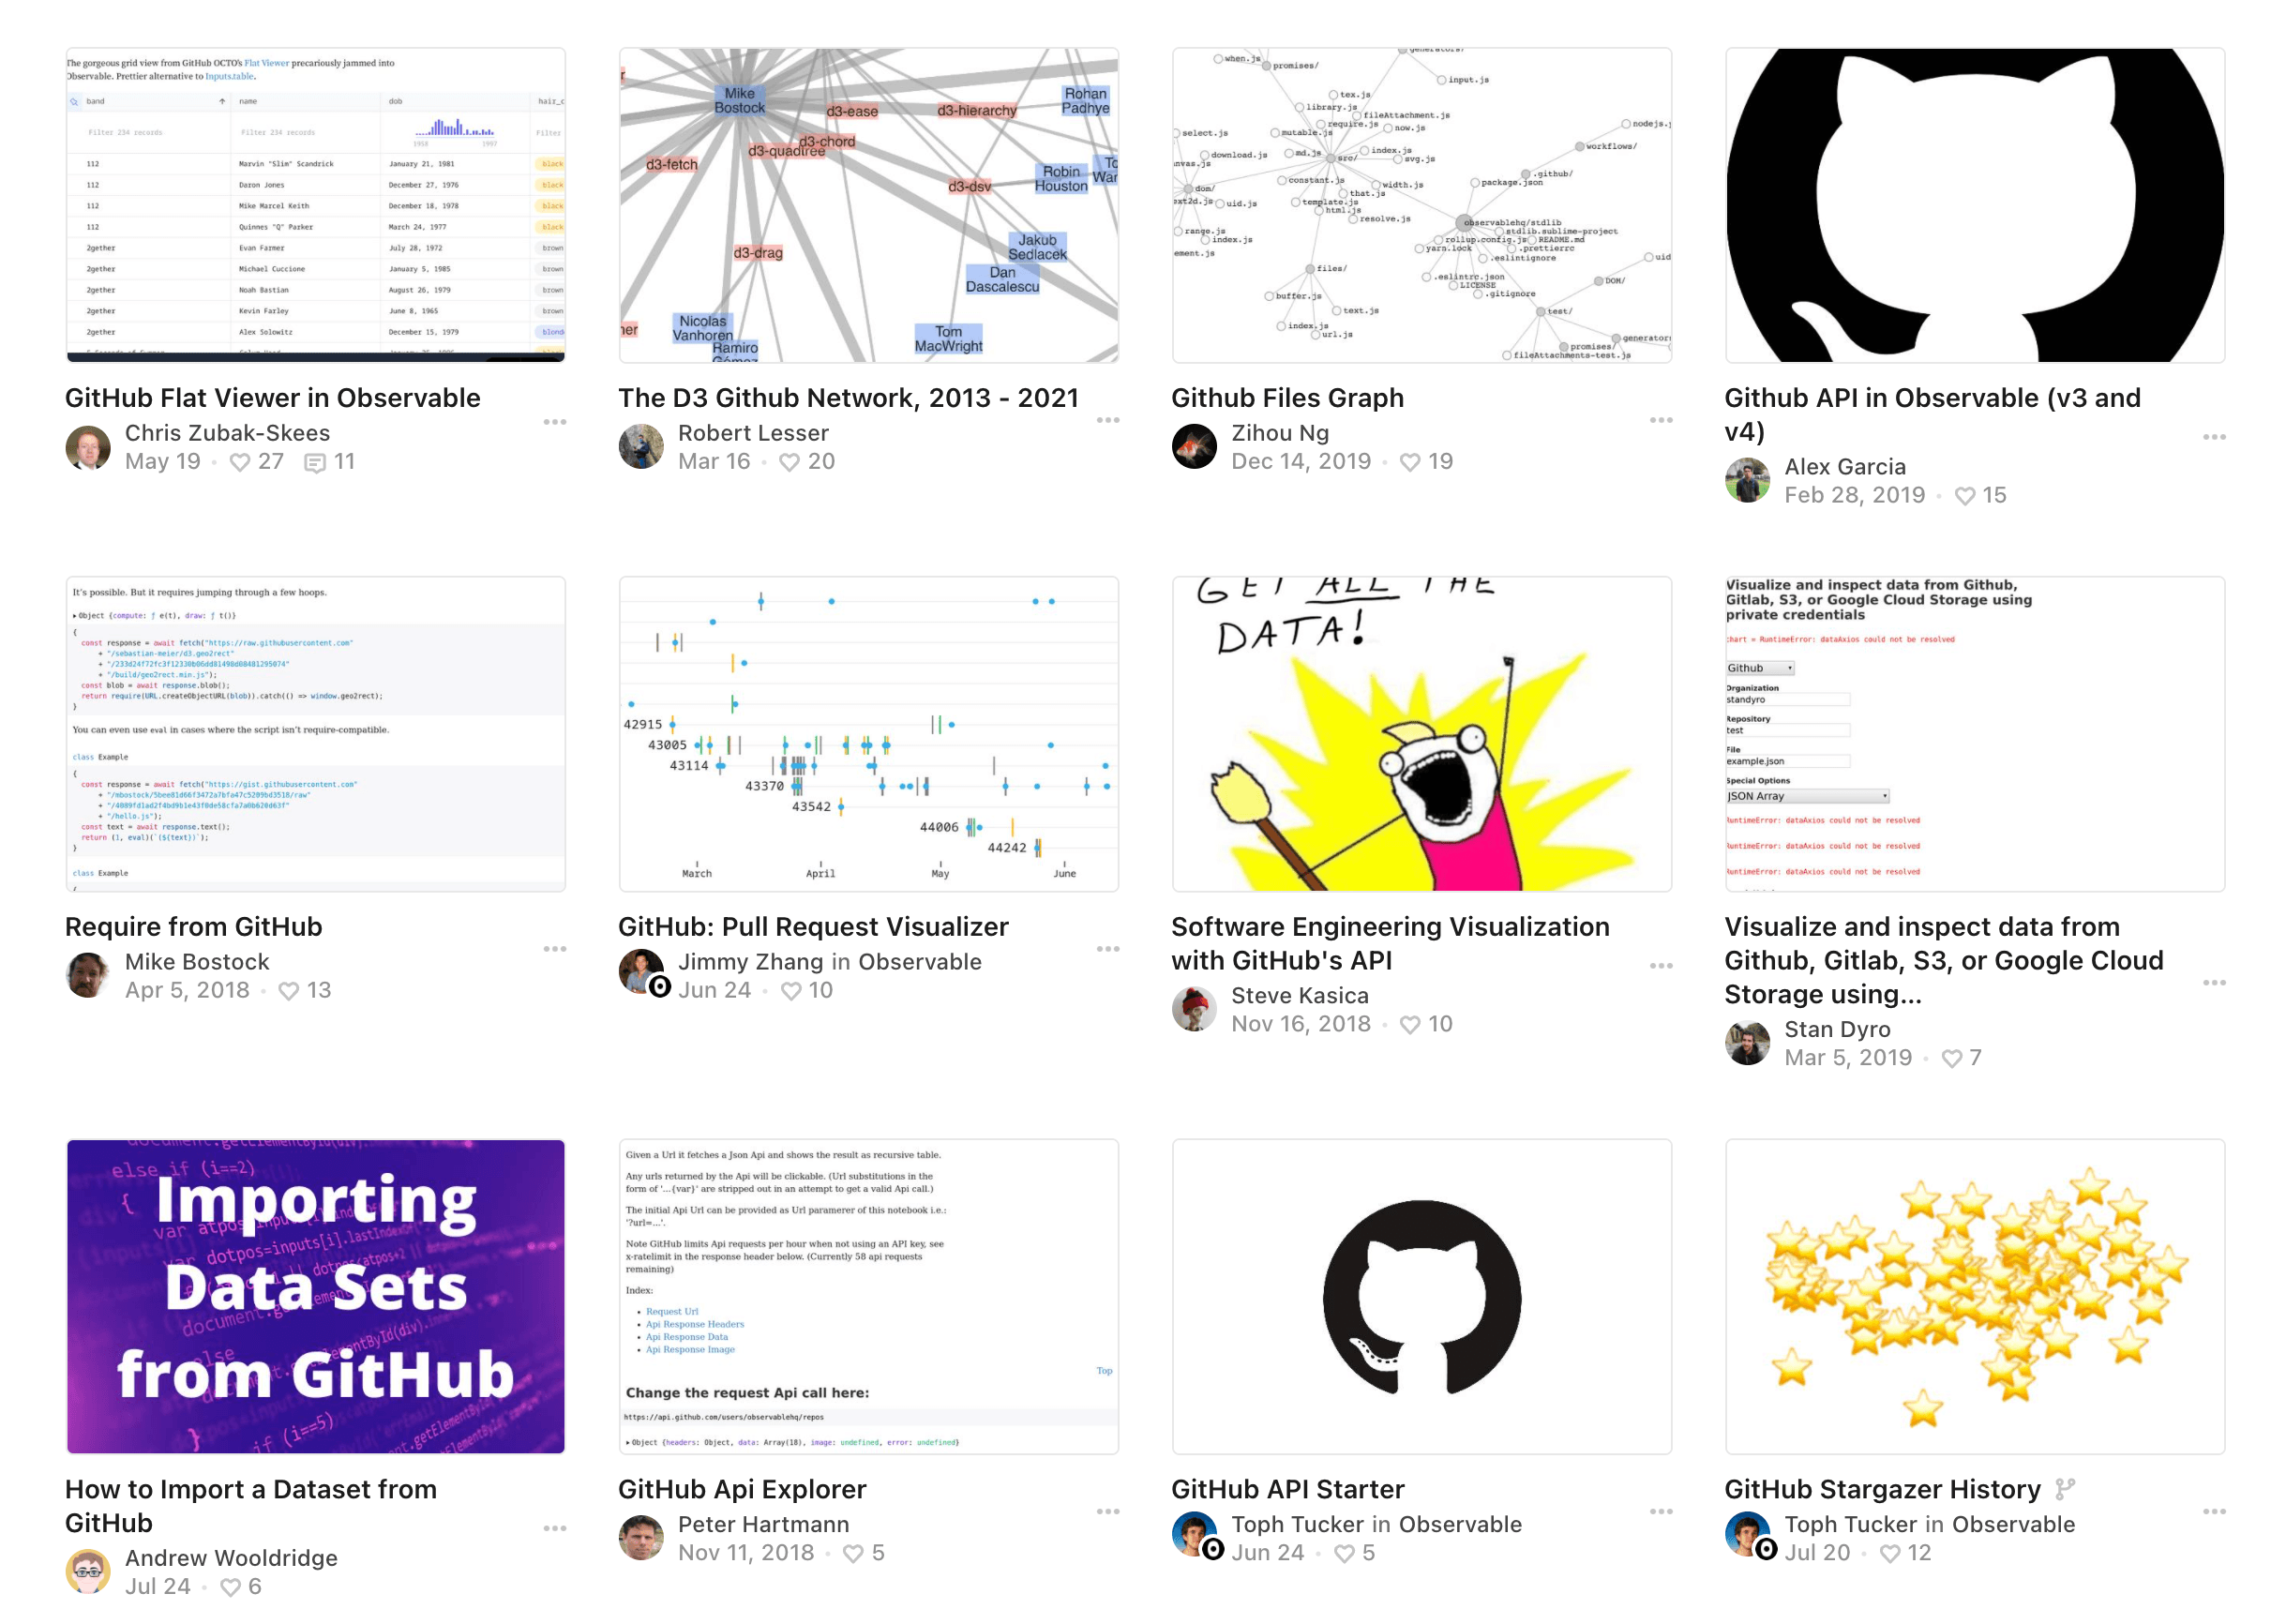
On Observable, there is a thriving community of developers using Observable to gain insights of their GitHub data. With more than 10K notebooks visualizing GitHub data, creators can get started by forking a notebook and adding their own data. You can get started with one of these notebooks today.
GitHub on Observable is a curated collection where you can find some of the latest and greatest Observable notebooks for GitHub. You can be inspired by and build on one of the many community created examples.
A bright visual future ahead
Observable commits to supporting great visualizations for GitHub users. We are grateful to all creators sharing their insights and visualization on the platform. Thank you!
We know GitHub users can solve problems visualizing your data and we're learning about new ways from the community regularly. Observable can make your work in GitHub more productive, and fun. Please join us and get started for free.
If you still need more information about Observable, check out the following:
The latest talk from Anjana Vakil on visualizing open source communities.
Some of my thoughts on why dataviz helps developers.
The State of Dataviz 2021 report sharing the latest research on how the community is growing and evolving.
If you’re interested in following along with the latest updates on the community, you can subscribe here.
And, if you have used Observable in a way that you think would help other developers, we’d love to hear from you. You can reach us at community@observablehq.com or join us at one of our upcoming Meetups.


