You may have heard that Observable Framework is a static site generator. But what does that mean and why would that be a good thing?
In short, it makes the experience for the users of your dashboards and data apps better by making them load much faster. It also reduces load on shared resources like databases, by querying data only once that might be used by many different people. In addition, it gives you more control over when the data is refreshed, which can be quite critical and is often overlooked.
This article is also available as a video here.
How a traditional business intelligence tool loads a dashboard
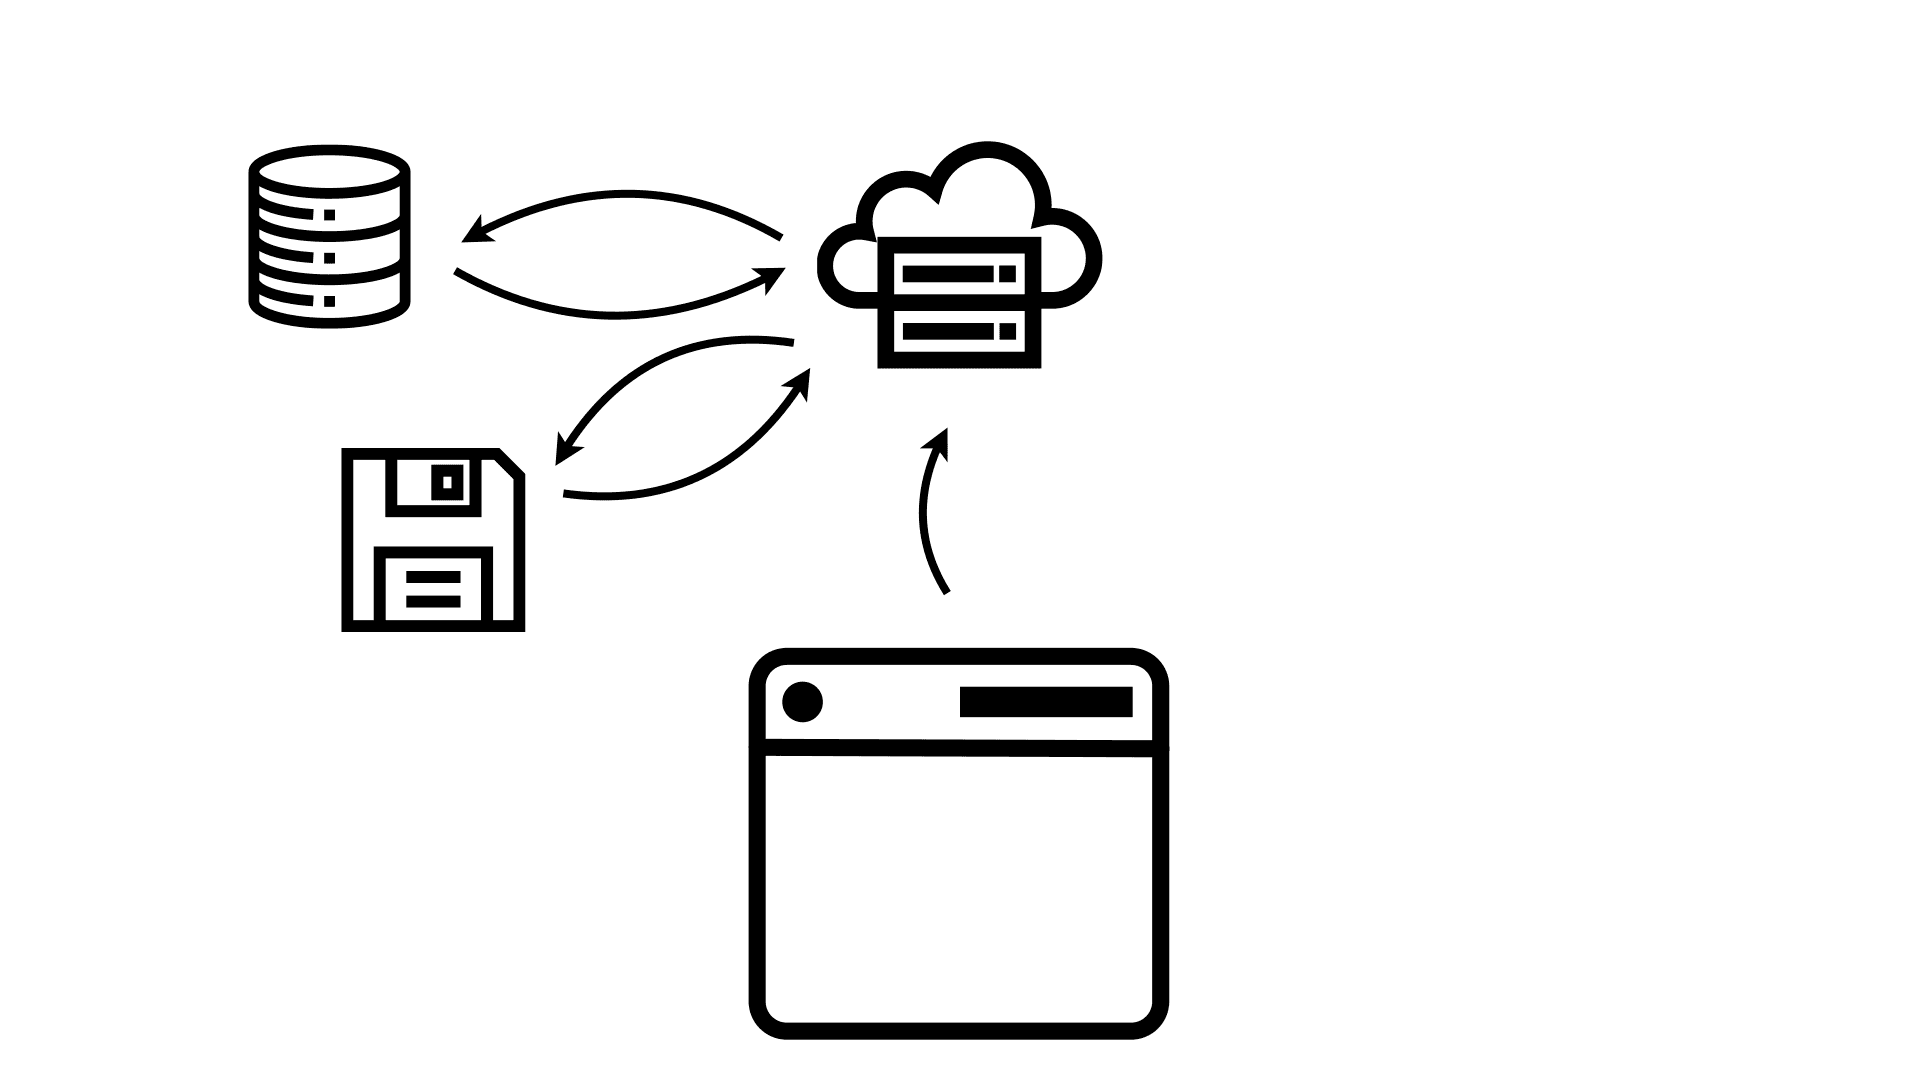
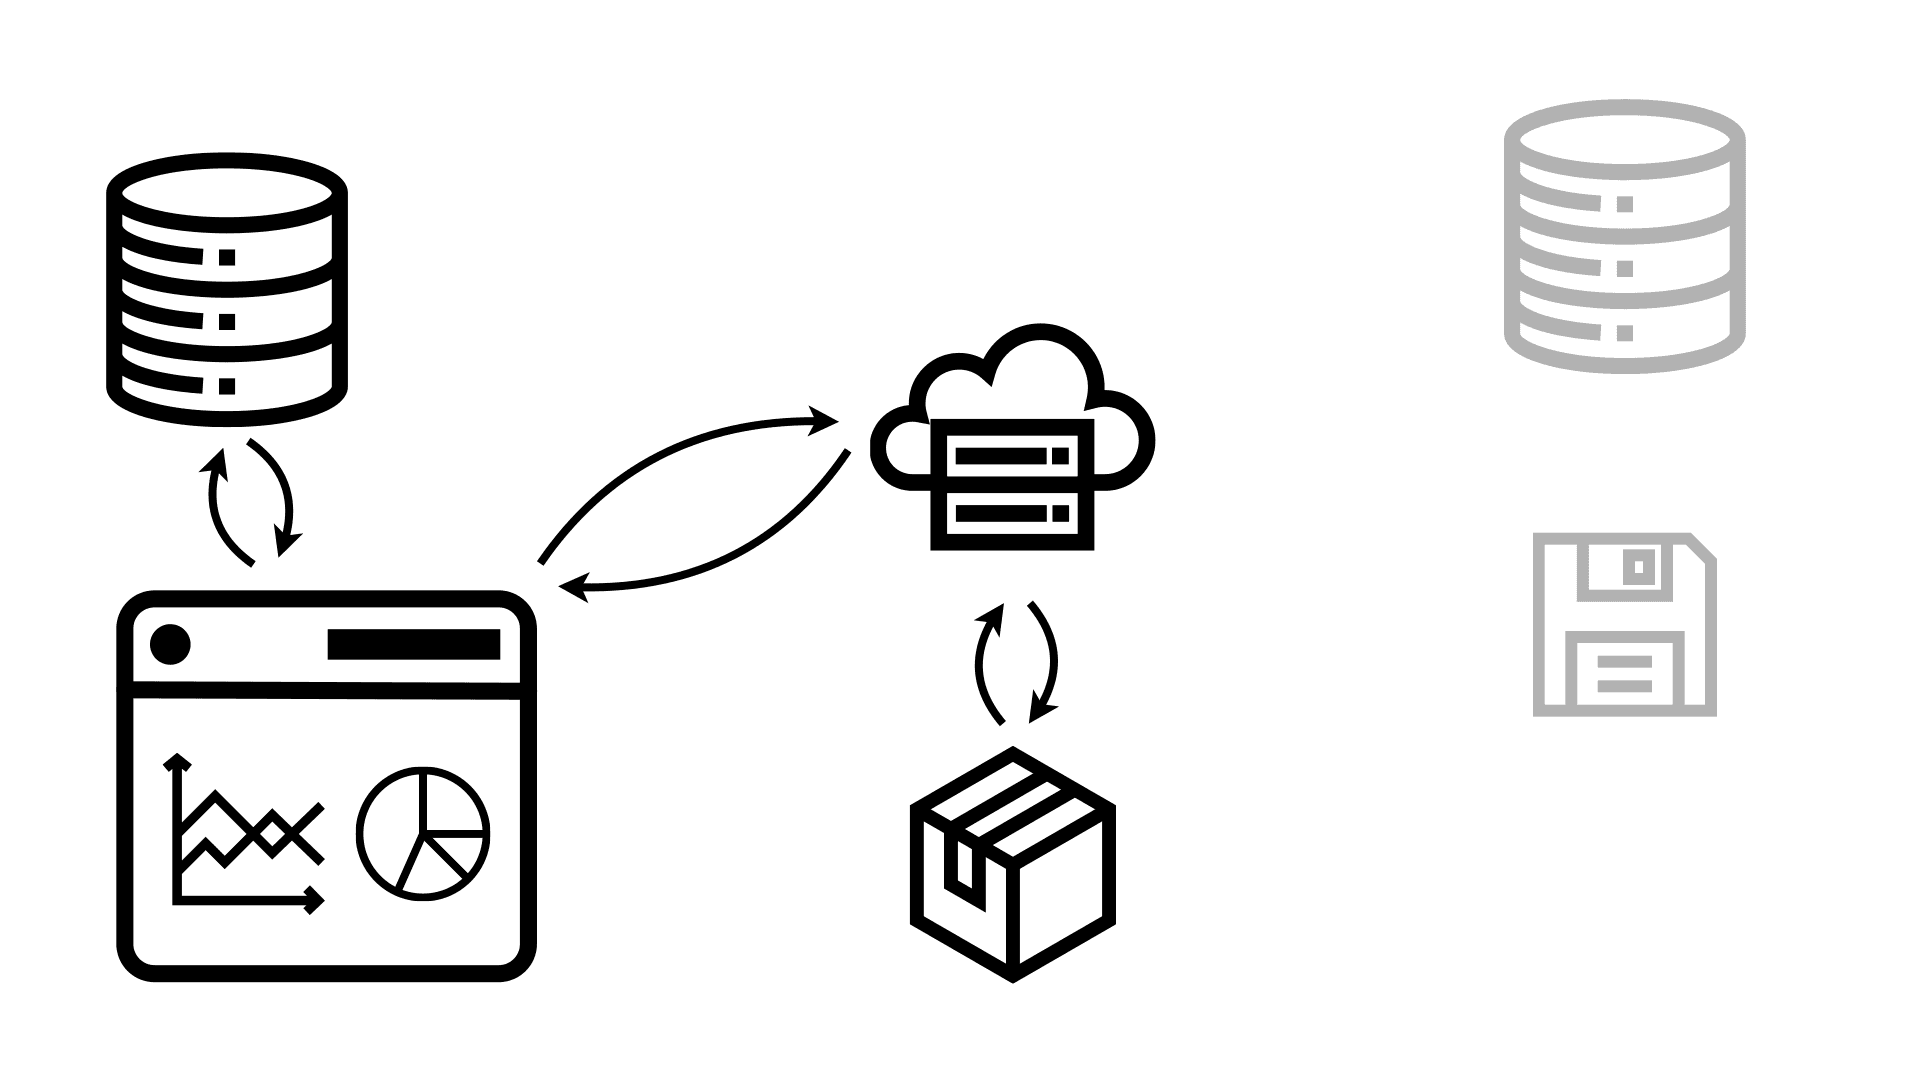
Let’s look at how a dashboard loads in your browser when you use a traditional business intelligence (BI) tool. To get the dashboard, your browser has to first request a page from the server. The server, in turn, has to figure out what goes onto that page. There are at least two parts to this, the structure of your dashboard and the actual data.
The structure can live in a database or a file, so the web server has to load that information now. If you’re familiar with content management systems like WordPress, they work the same way – and have the same performance issues.
Once it knows the structure, it can now query the big database for the actual data to be shown. This can also take a while because production databases aren’t usually optimized for analytical queries. It then has to run any data processing on it to create the result set that the browser needs to render the dashboard.
Finally, the entire thing gets packaged up and returned to the browser, which can now render the dashboard for the user. But the user kicked off this whole process and then had to wait for it to complete.
The "static" part of a static site generator
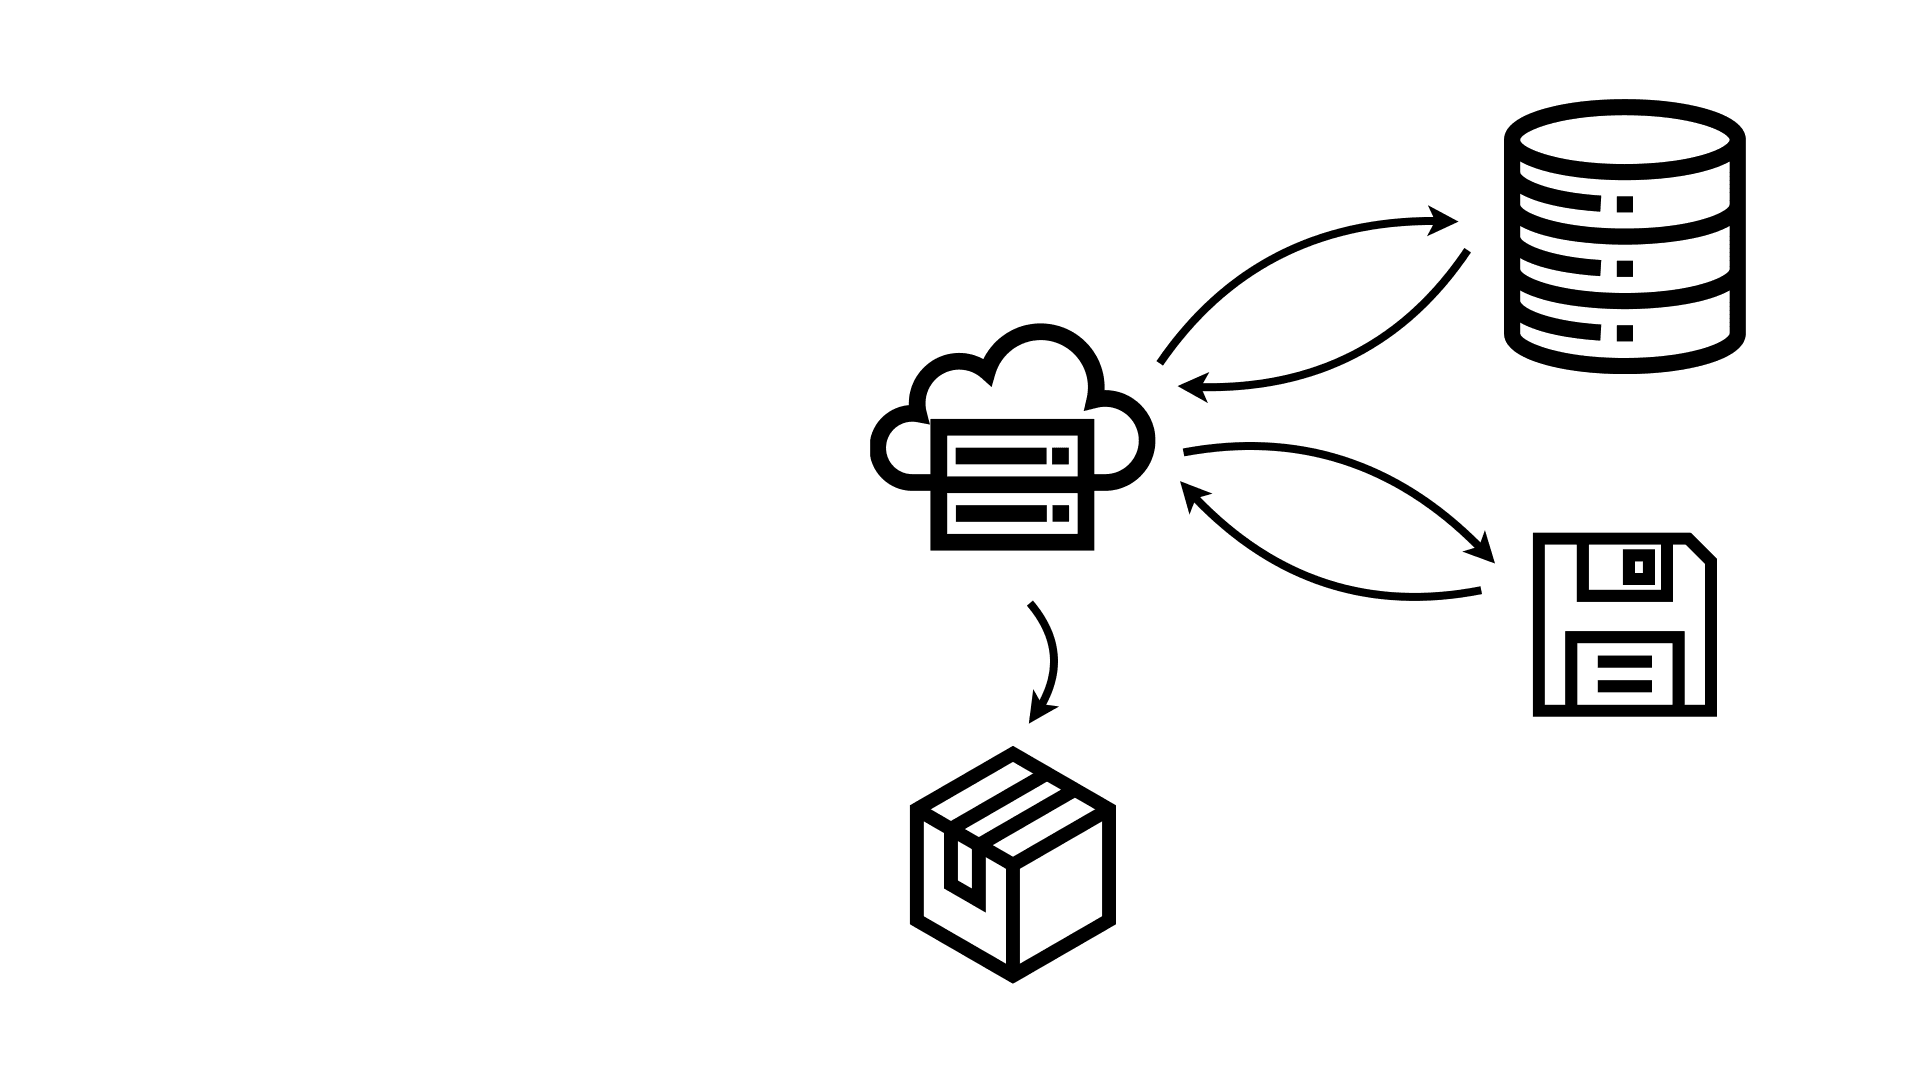
A static site generator like Observable Framework works very differently. A build process runs independently of the user. It accesses the code and data, which might be coming from files and databases. It can run lengthy queries, complex data transformations, etc., that may take a long time to complete.
The results of this process then get packaged up into a small package that contains the code and result data. This is the “static” part of a static site generator, because Framework generates a file, or a small handful of files, that contain the product of all of these processes in the same shape as what would be sent to the user’s browser. It’s also usually quite a bit smaller because it can be aggregated to the appropriate level of detail, and optimized for space efficiency.
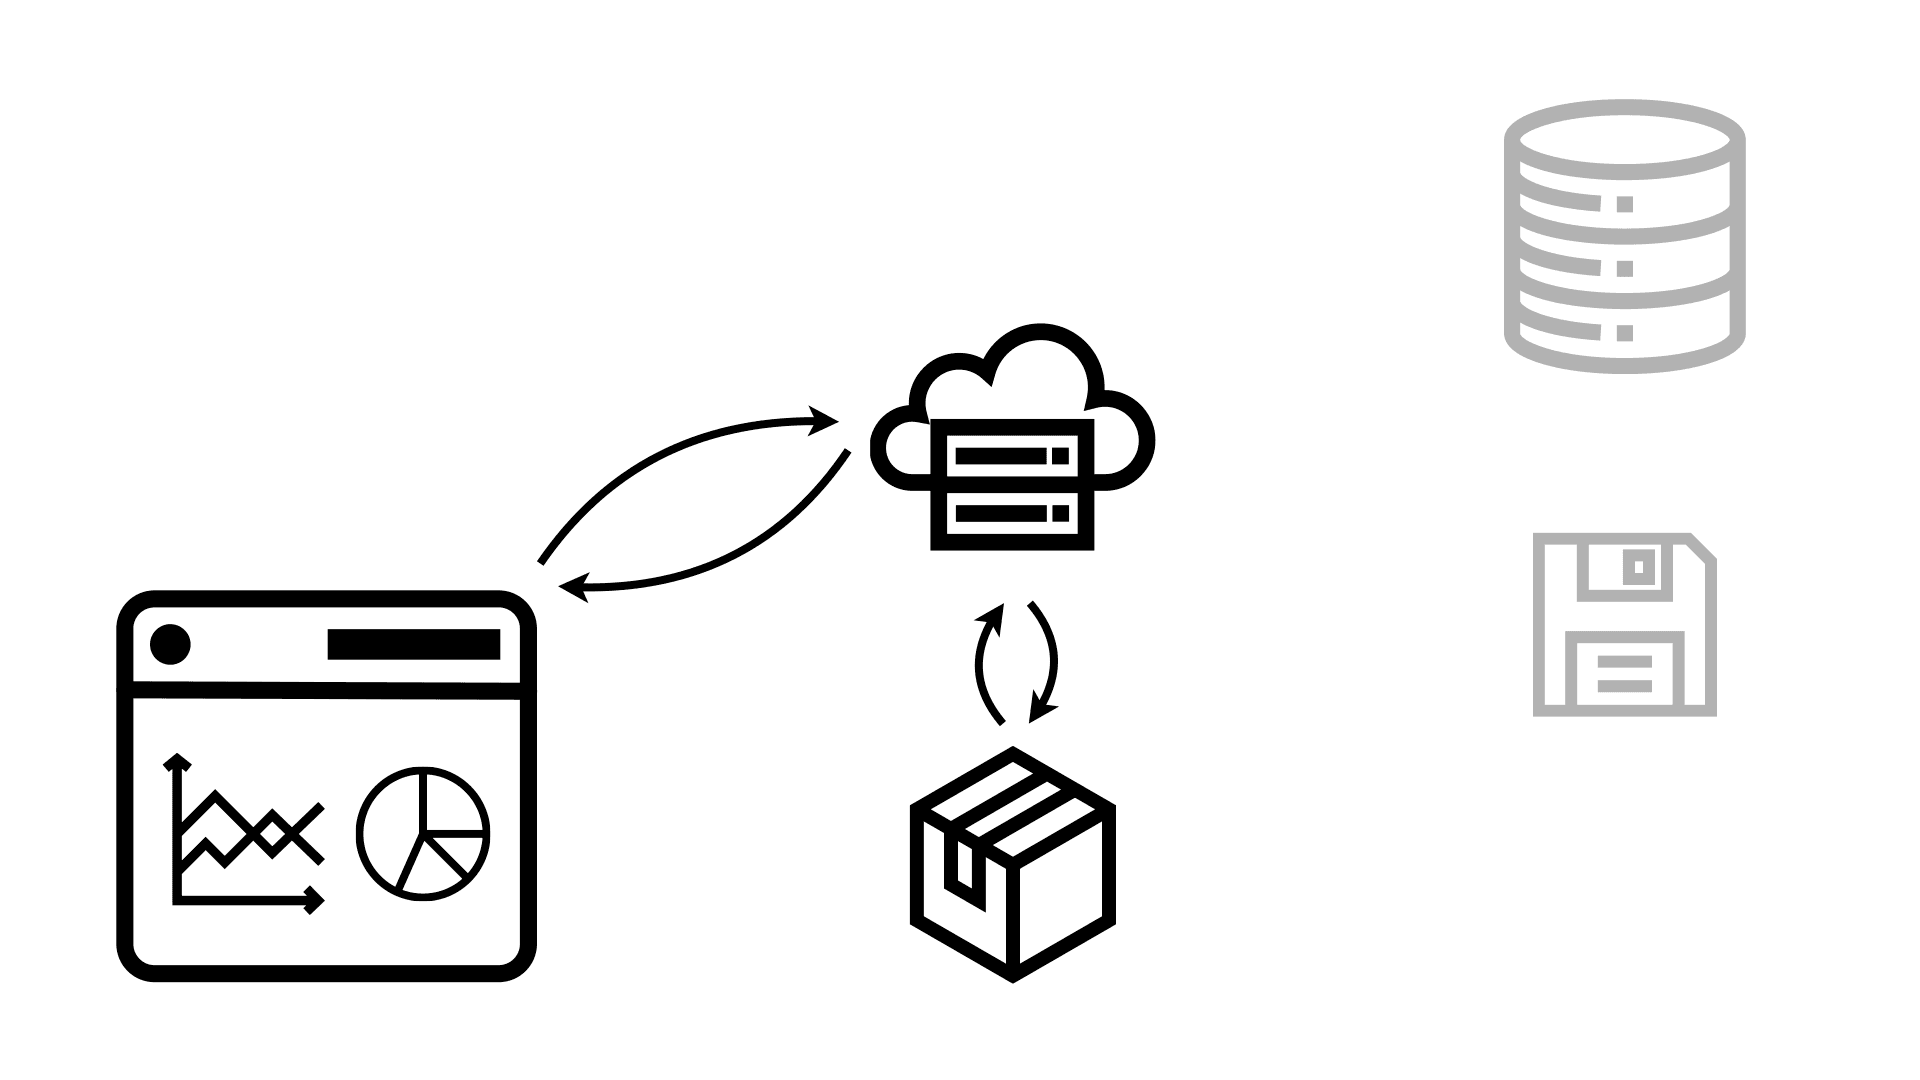
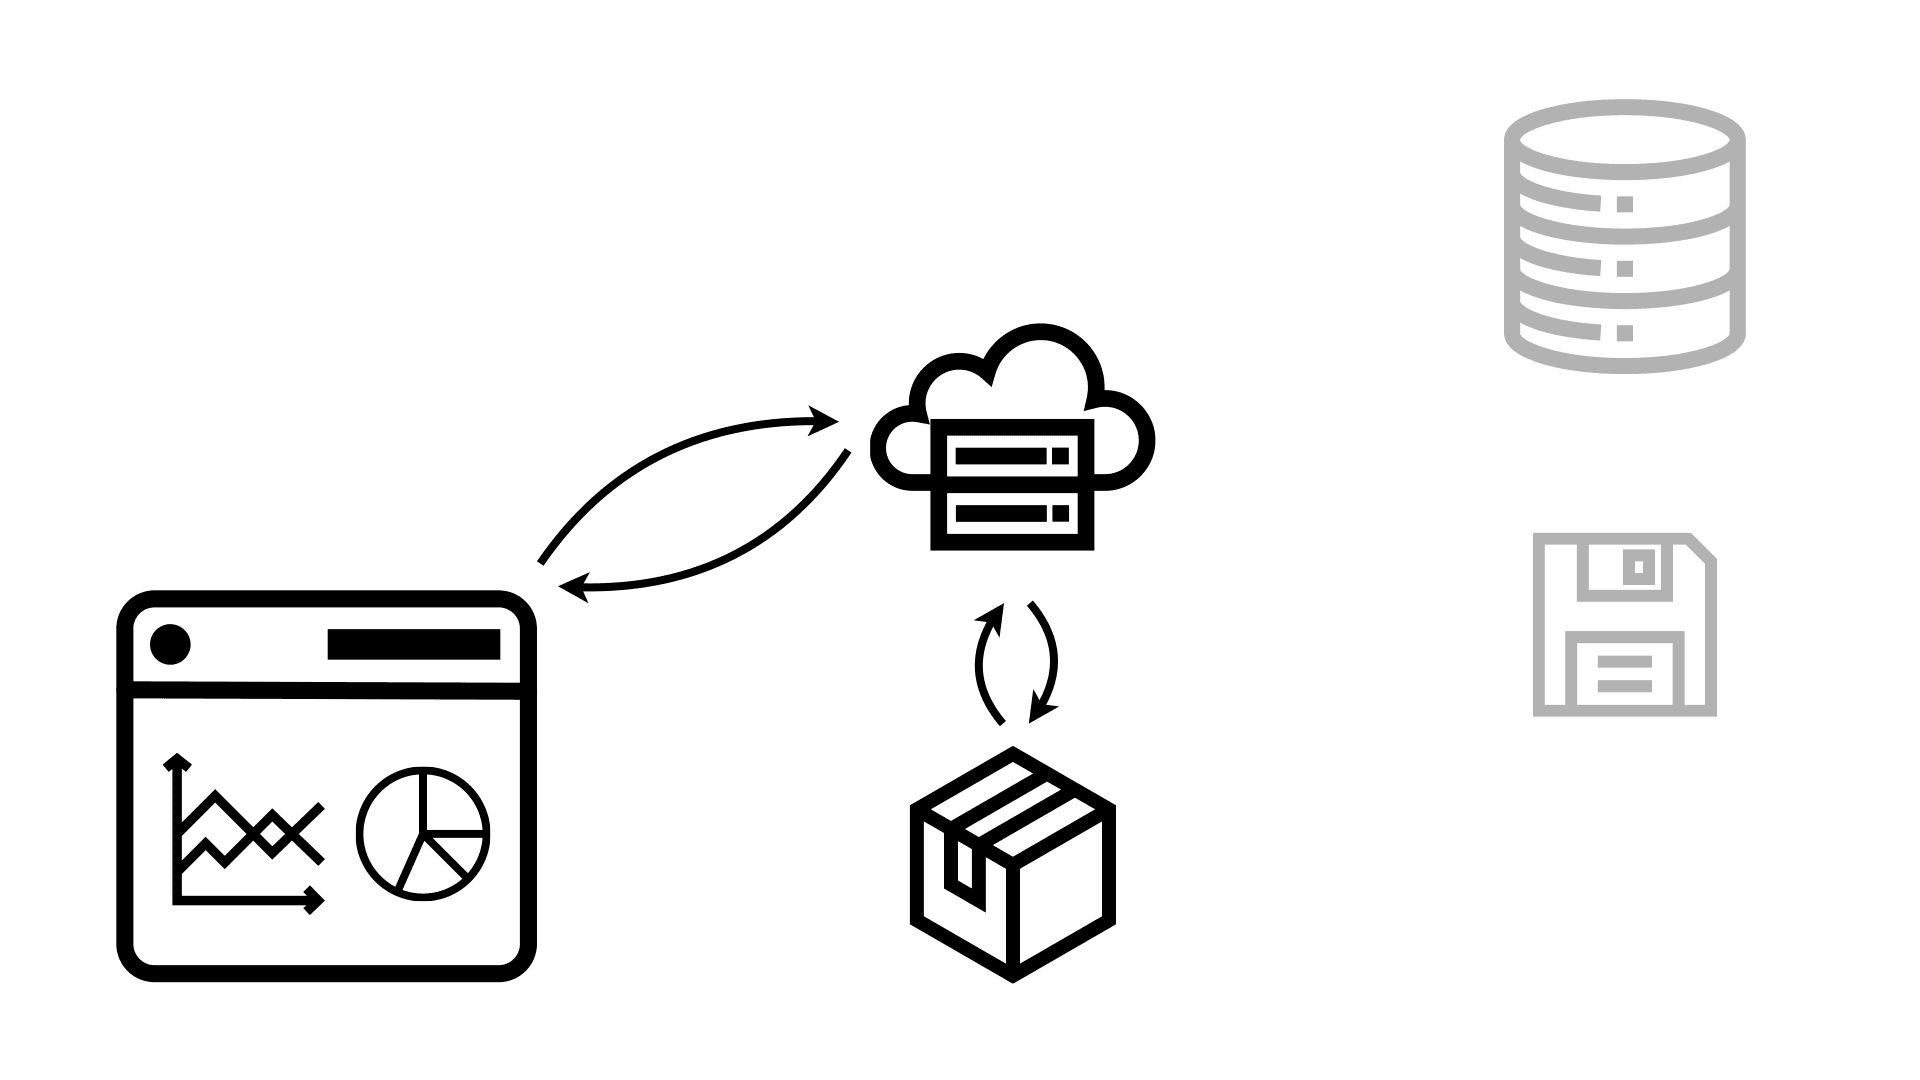
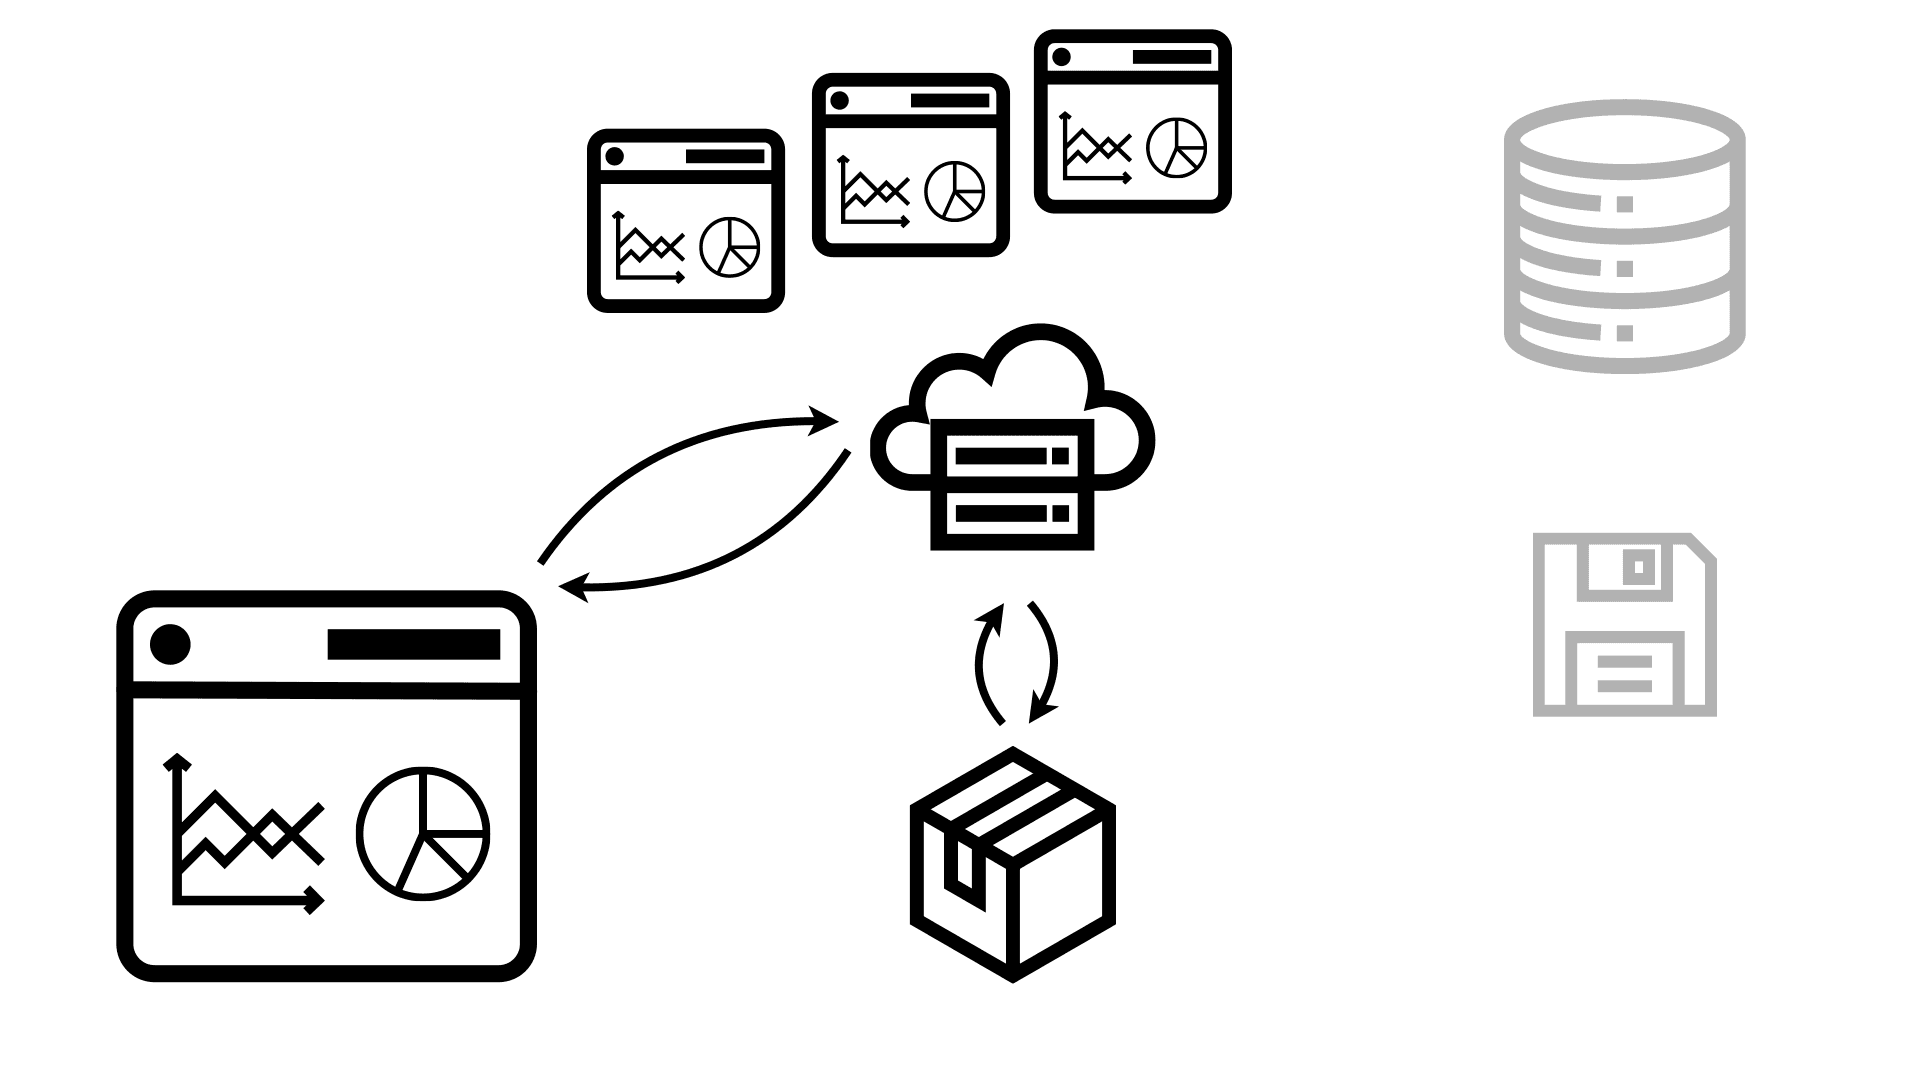
Now when the user requests the dashboard or data app, all the server has to do is access that package and send it back to the user’s browser, which then uses it to render it onto the screen. This is much faster because all the slow operations have already happened without the user having to wait for them.
Now just because this is a static site, doesn’t mean that it can’t still access databases from the browser directly. In fact, because Observable Framework uses code, you have all the flexibility to do whatever you want here. This also includes querying data the dashboard was sent from the server in the package, to drill down, change filters, etc.
But the key advantage is that even if many people request the same dashboard, that doesn’t generate more load on shared resources like databases. They all get served the same static package, and they don’t get slowed down by other people querying the exact same data from a database.
Scheduled builds for controlled data updates
Now you might wonder how this works if you want your data to be up to date. The key here is that for most use cases, changes to your data during the day or even during a week or month aren’t material and can be more of a distraction than actually help make decisions. We have a blog post about this, Better dashboards align with the scales of business decisions.
But a common problem is the appearance of a trend when there’s just incomplete data. Like in this case above, where we might have an incomplete day or week at the end. Once we’re past this point and the data is complete, it might look quite different.
The answer to this is scheduled builds that run at certain intervals. These can be short, for example you might run your builds every hour. But more likely, you’re going to run them once a day, week, month, or even quarter.
This is certainly not the case for all data, but for the vast majority of business use cases, a properly managed process of scheduled updates will lead to more useful dashboards and fewer distractions caused by noise or incomplete data.
What about row-level security?
A common question about static-site generators is whether they can handle row-level security. The answer is yes, they do.
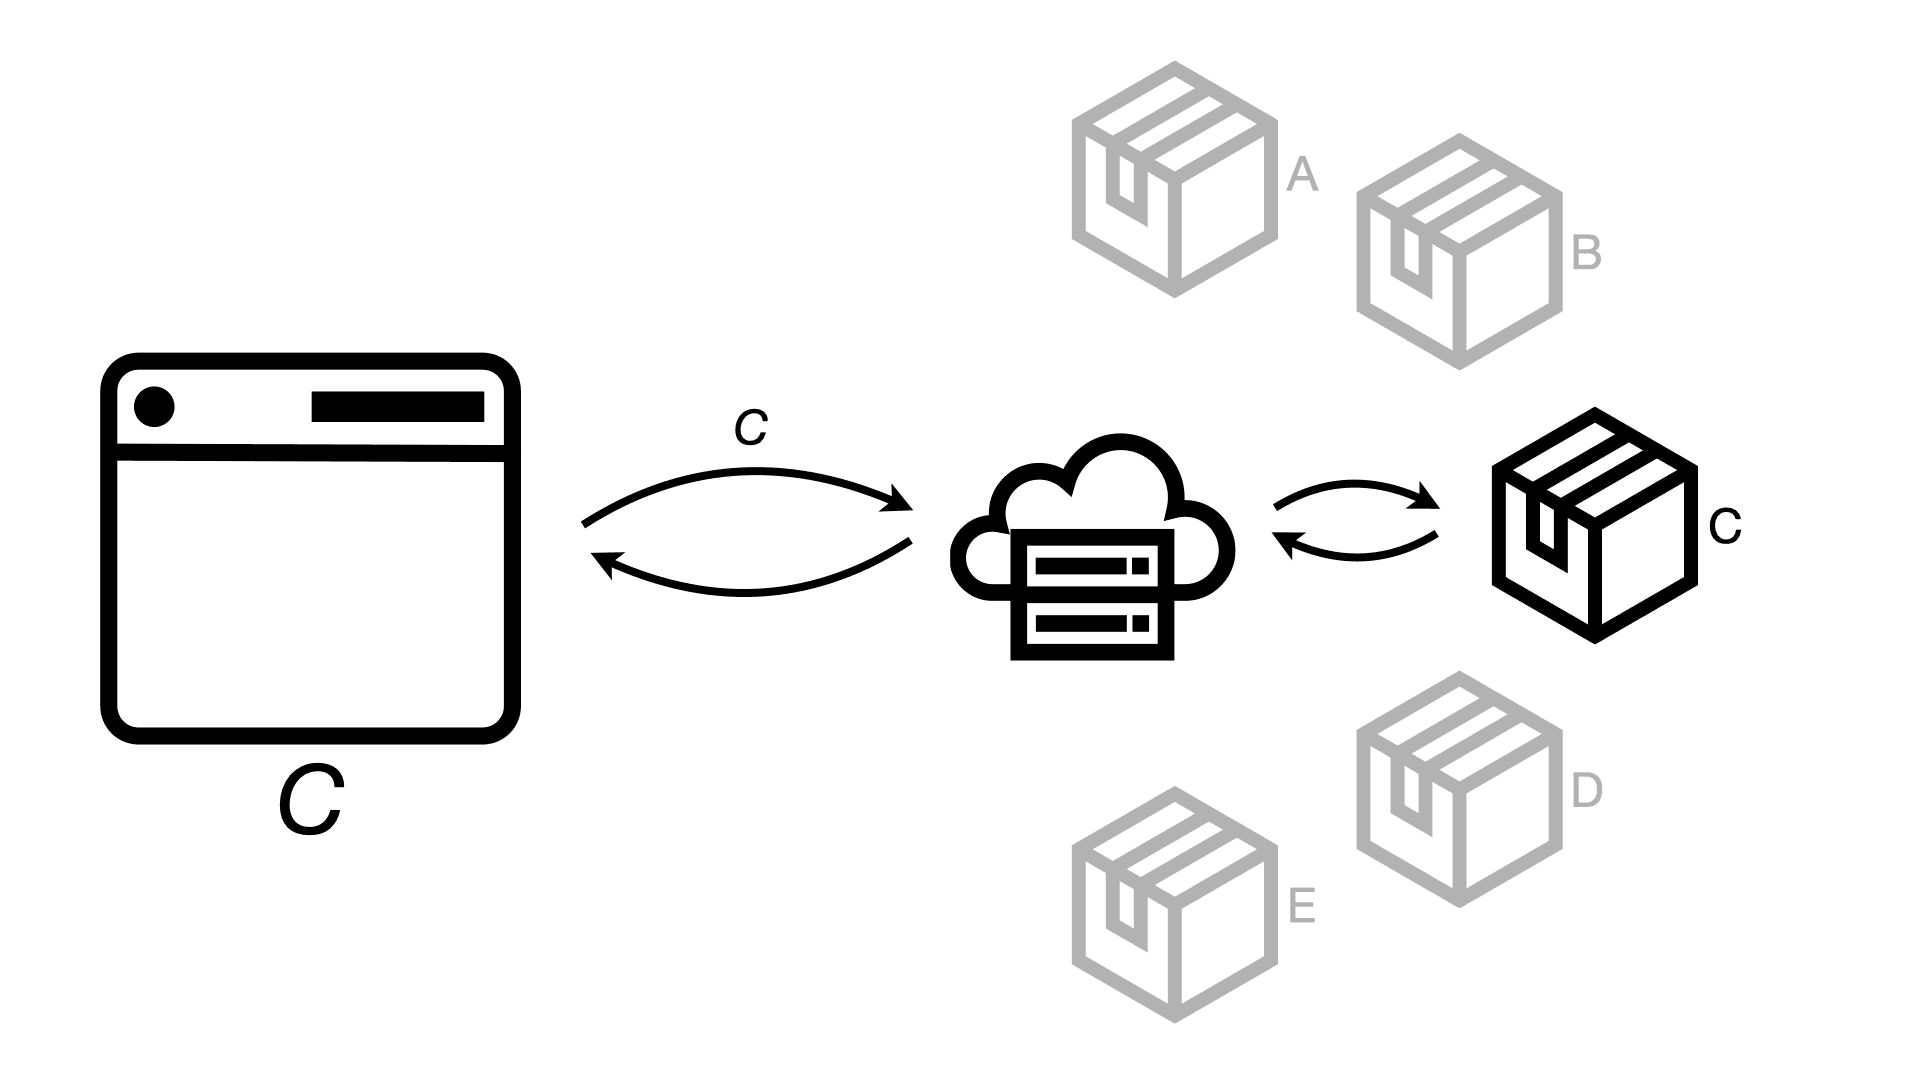
Rather than just one package, the build process can create separate packages for each user or role. That way, when the request comes in, the server can then decide which package to serve them.
This might seem to go against my earlier point about not having to run so many queries, but the build can be much more efficient with its queries than having to do it fully on demand for each user. The result is also still much faster for the user; and maybe your user permissions are by department or role, in which case multiple people still get served the same exact package.
Summary
A static site generator does not mean that the data is static, or even stale, or that the dashboards can’t be interactive. Quite the opposite. Because you can do so much more processing and Observable dashboards are built with code, you can enable many more ways to interact, explore, and model, than with traditional BI tools.
Observable Framework makes for much faster dashboards, lower server load on your shared databases, and more useful dashboards with scheduled data updates.
