Today we’re launching Observable 2.0 with a bold new vision: an open-source static site generator for building fast, beautiful data apps, dashboards, and reports.
Our mission is to help teams communicate more effectively with data. Effective presentation of data is critical for deep insight, nuanced understanding, and informed decisions. Observable notebooks are great for ephemeral, ad hoc data exploration. But notebooks aren’t well-suited for polished dashboards and apps.
Enter Observable Framework.
With Framework, you can build the best data apps your team has ever seen. Framework combines the power of JavaScript on the front-end for interactive graphics, with any language on the back-end for data preparation and analysis. SQL, Python, R, Rust, Go… you name it. It’s the polyglot programmer’s dream. Everything you need is at your fingertips: interactive charts and inputs, responsive grids, themes, dark mode, keyboard-friendly navigation, and more. And because it’s code, there’s no limit to customization!
Framework is free and open-source. Projects are just local files. Use your favorite editor, preview locally, check it all into git, write unit tests, add CI/CD, even work offline. You can host projects anywhere or deploy instantly to Observable to share them securely with your team.
Observable Framework solves the “last mile” problem of data apps: loading data. Conventional dashboards are slow because they run queries on view while the user waits; Framework’s data loaders run on build so that pages load instantly. And because data loaders run on your servers, you control privacy and security. If you’re ready to dive in, visit our Getting started tutorial, or open a terminal and run:
If you’d like to hear more about why we built Framework, please read on.
Beyond notebooks 📓
This moment — Observable 2.0 — reflects lessons learned over many years.
We believe the lightweight, collaborative nature of computational notebooks makes them ideal for exploring data and answering ad hoc questions. We founded Observable in 2016, pioneering a reactive, web-first approach to notebooks and seeking to make data visualization easier, more practicable, and more social. We dreamed that notebooks might be the “one ring to rule them all” — powering not just notes, but apps, dashboards, and reports.
Yet no single interface can excel at every task. As cool as reactive notebooks are, a notebook can’t compete with a custom web app in terms of user experience. Notebooks are constrained by:
A single-column, narrow layout
Low visual information density
Always-visible editor chrome
These same limitations make notebooks great for tinkering and learning — the code is always at your fingertips, adjacent to the output — but not so great for presentation. To fill that latter role, we need better data apps.
A good data app embodies an empirical perspective; it fosters a shared understanding. Whereas notebooks tend to be for individuals, data apps are more often for a team. And whereas notebooks tend to be transient byproducts of point-in-time exploration, data apps often sustain value over time as people return to see how things change.
The differences between notebooks and data apps extend to development. A notebook editor desires speed: jotting down thoughts, running a query, sketching a chart. A data app developer prioritizes correctness, performance, and maintainability: making careful, deliberate changes that others depend on, favoring code review and testing before publishing.
We had three goals in mind when we set out to reimagine data app development:
A better developer workflow — meeting the needs of developers
A better user experience — the “proof is in the pudding”
A better data architecture — solving the “last mile” problem
A better developer workflow 👩💻
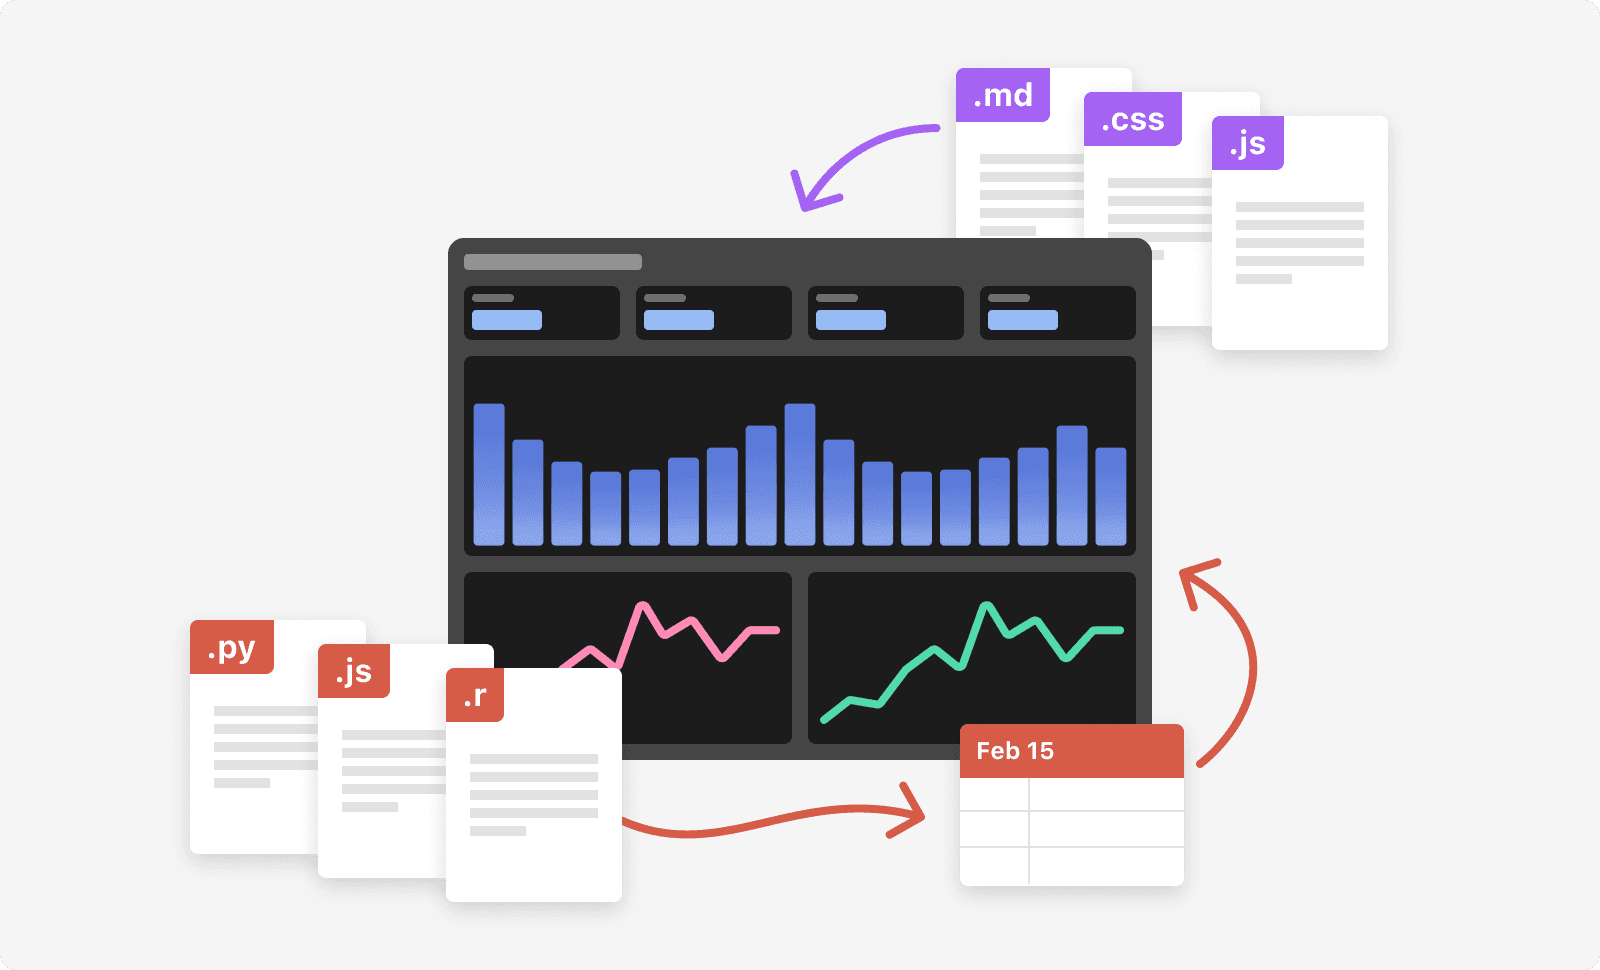
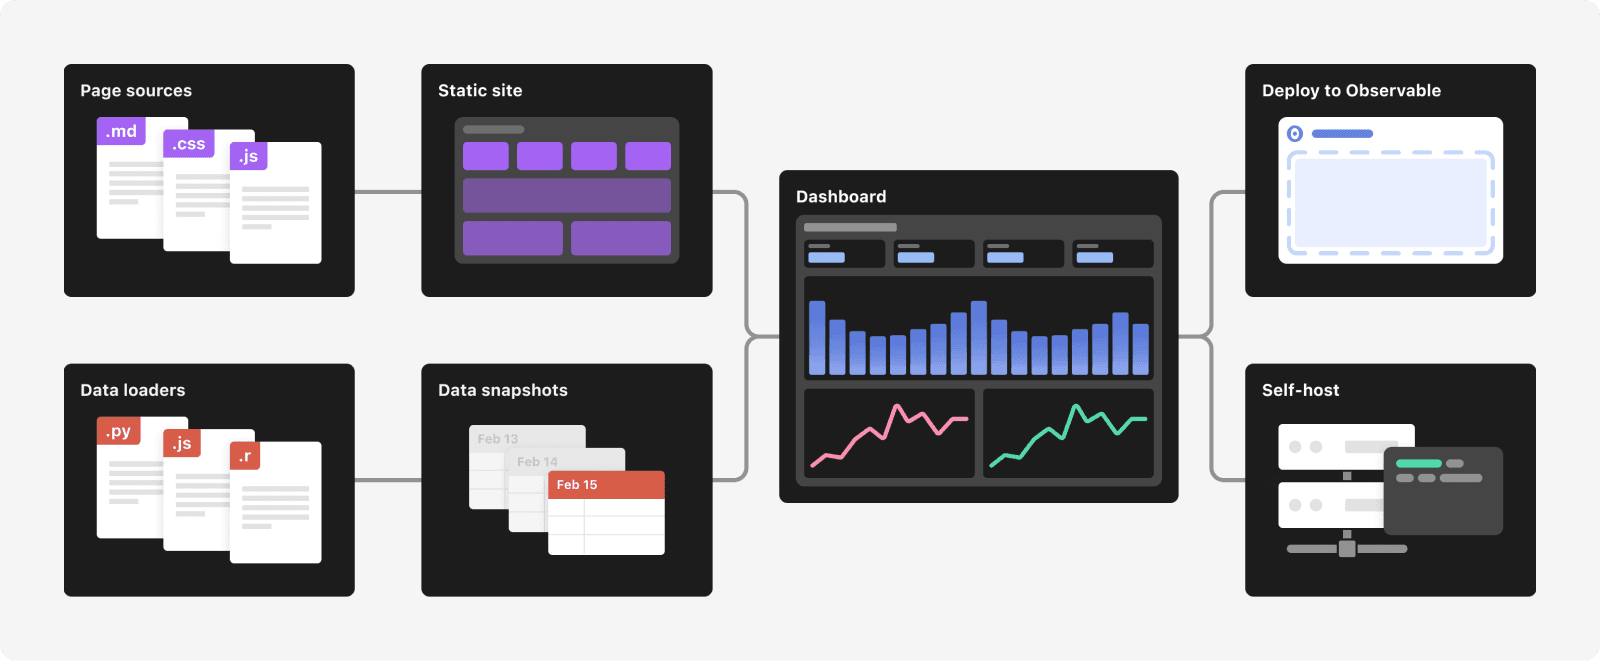
Modern development is built on files. Files have myriad strengths, but the strongest is interoperability. When every tool uses files, it’s far easier to incorporate a new tool — and now Observable — into your workflow.
This isn’t just about using your preferred text editor. Now you can bring your own source control and code review system, too. You can write unit tests and run linters. You can automate builds with continuous integration or deployment. You can work offline. You can self-host. You can generate or edit content programmatically, say to format code or to find-and-replace across files.
As we break new ground with Observable Framework, we’re further improving interoperability by adopting vanilla JavaScript syntax. And we’re deprecating require in favor of modern ES import. These changes make Observable easier to learn, and to share code with other applications. (We’ll port these improvements back to Observable notebooks in the future.)
Check out our examples on GitHub.
A better user experience 😍
A toolmaker can’t care only about the developer experience — what does the developer experience matter if the resulting app is not demonstrably better? The merit of a creative tool should be judged by the quality of its creations, not its process. Or: “the proof of the pudding is in the eating.”
We believe that well-designed tools help developers build more efficiently by focusing their efforts on high-value work. We favor opinionated tools, with defaults and conveniences that foster a good user experience. We nudge you into the pit of success.
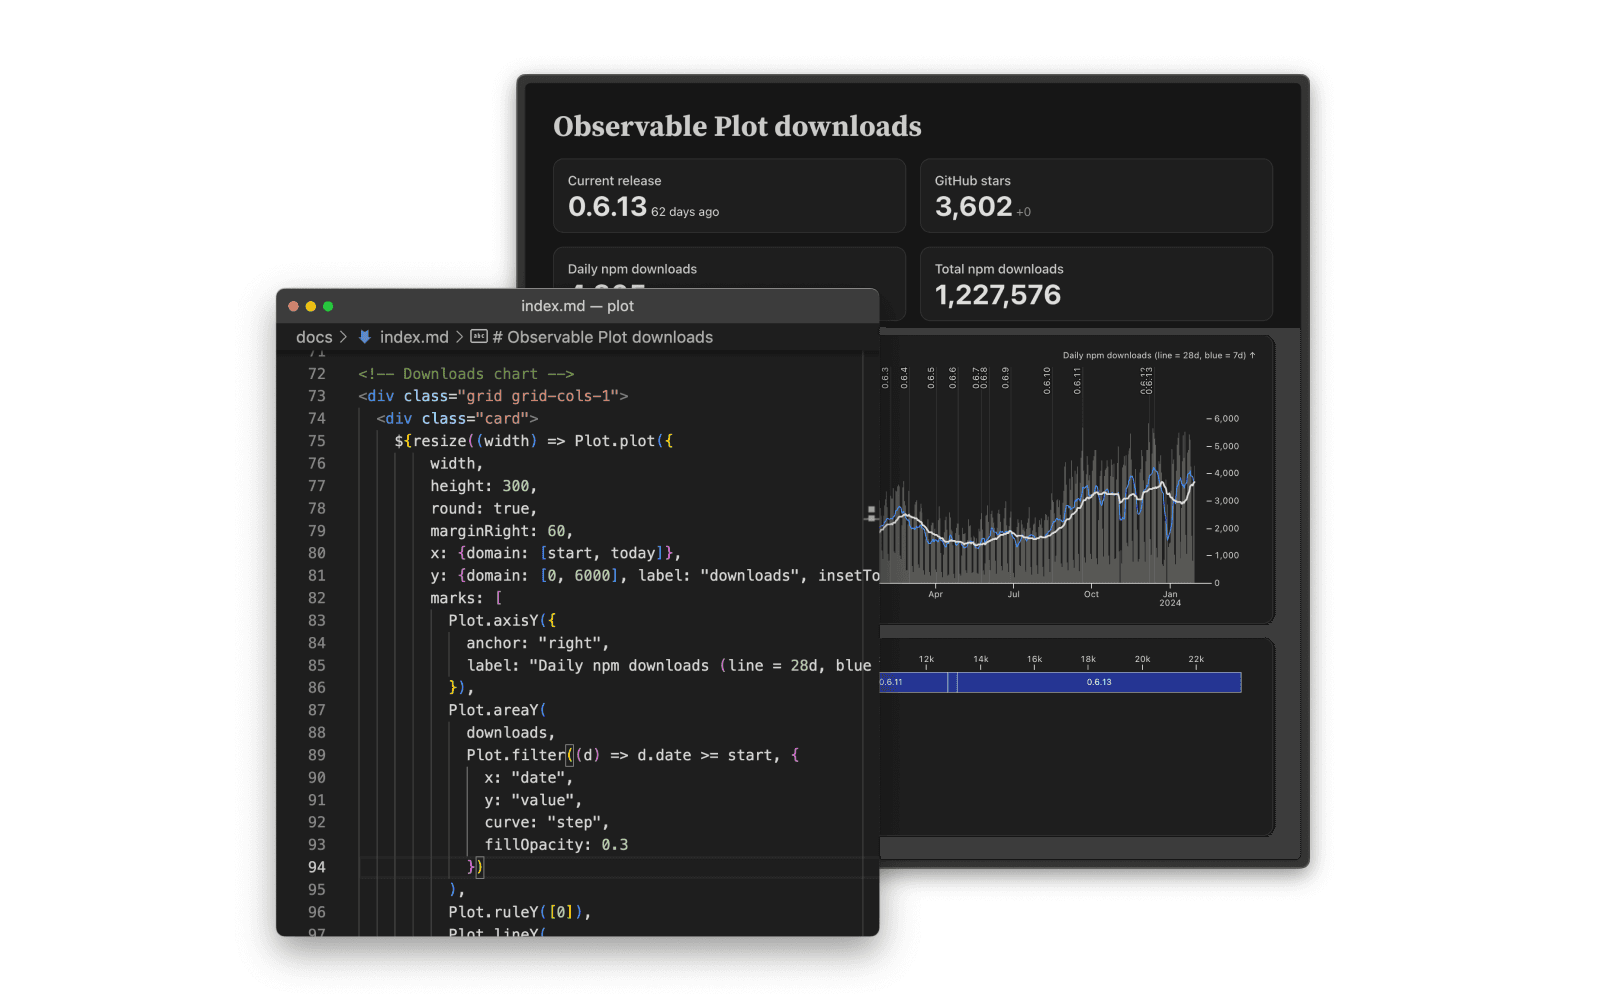
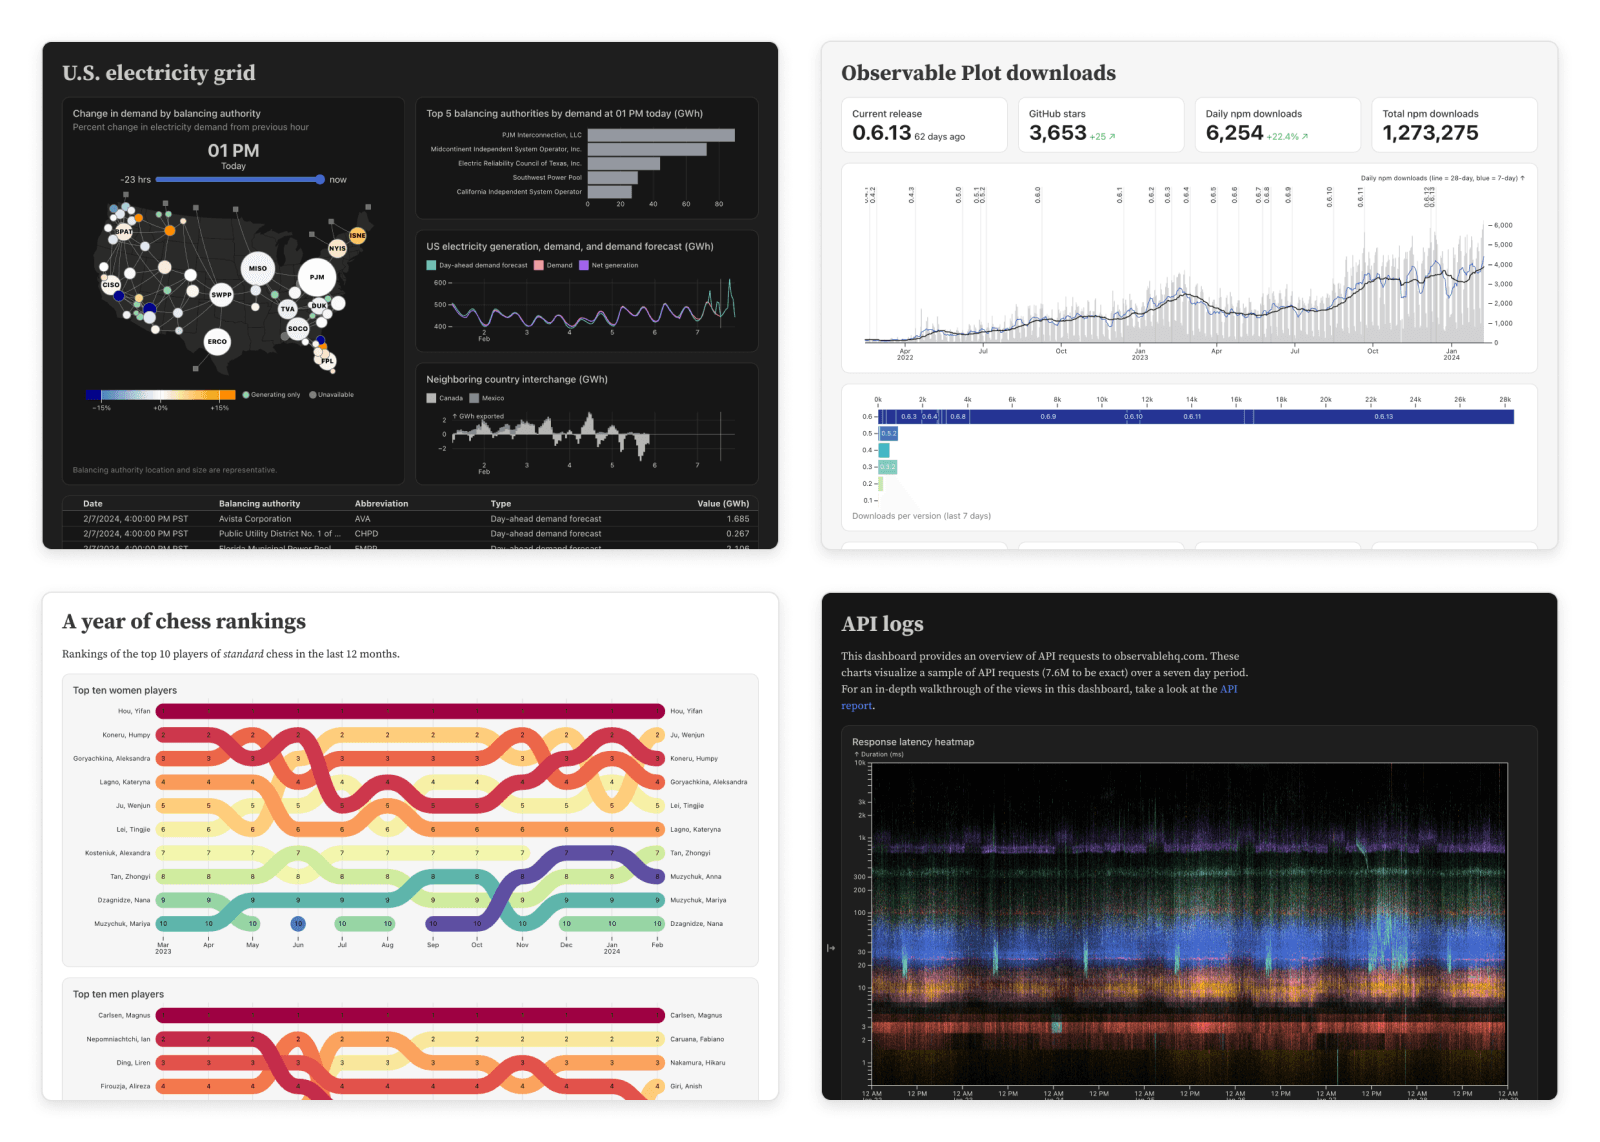
Framework’s lightweight Markdown syntax — with light and dark mode, thoughtful colors, responsive grids, and built-in navigation — gives you beautiful pages from the start. It’s highly customizable if you need it, but it’s quick to get started with batteries included.
Most importantly, Framework’s data architecture practically forces your app to be fast because data is precomputed. Performance is critical for dashboards: users don’t like to wait, and dashboards only create value if users look at them. Slow dashboards waste time. (And you certainly don’t want your database and dashboard falling over under load!)
A better data architecture
Every data visualization requires data. Obviously. But less obviously, each data visualization requires highly-specific data prepared with that visualization in mind. In fact, most of the work of visualization isn’t choosing visual encodings or laying out axes or visualizing per se — it’s preparing data. As I wrote previously,
working with data should be 80% of the work of visualization. Visualization is the end result of analysis — the visible manifestation of data, to be seen, shared, and appreciated by experts and non-experts alike — and as such it sometimes gets too much credit. To produce a visualization, one must first find data, clean it, transform, join, model, etc. Working with data is sometimes needlessly denigrated as “janitorial” when it represents the critical step of understanding the data as it is, warts and all.
Given how much work goes into preparing data, it follows that developers want
to use any language (say Python or R or SQL),
to use any library (say NumPy or dplyr),
to use any data source (database, data warehouse, API, files, etc.), and
to crunch data ahead of time (offline)
while still leveraging JavaScript in the browser for interactive graphics.
Framework’s data loaders solve this “last mile” problem by computing static data snapshots at build time. These snapshots can be highly-optimized (and aggregated and anonymized), minimizing the data you send to the client. And since a data loader is just a fancy way of generating a file on-demand (with clever caching and routing), loaders can be written in any language and use any library. This flexibility is not unlike CGI from 30 years ago, and Unix pipes. And since data loaders run on your servers, viewers don’t need direct access to the underlying data sources, and your dashboards are more secure and robust.
The speed of modern data warehouses is astonishing. But far too often something is missing for new analysis — some untapped data source, some not-yet-materialized view for a query to run at interactive speeds. Framework’s data loaders let you bypass these hurdles and produce a fast dashboard without “heavy lifting” in your data warehouse. And once your analysis demonstrates value, you can shift work to your data warehouse and simplify your data loaders. Framework lets you build faster and quickly validate your ideas.
We believe Framework will change how you think about data, and effect a better user experience. And by securely hosting apps alongside notebooks, Observable now offers an end-to-end solution for data analysis and presentation.
Thank you 🙏
We wouldn’t be here without the support, feedback, and encouragement from you — our community. Thank you for using Observable notebooks, Observable Plot, and D3. We’re thrilled to share Observable Framework with you now, and can’t wait to hear what you think.
To learn more about Framework, read the docs.
To share your questions or feedback, please visit our forum.