Observable has a lot to offer. The fast and flexible two-dimensional way of working on Observable Canvases. The built-in real-time collaboration. The powerful visualization capabilities. All built on a modern, web-first platform.
Read on as we lay out the many reasons for choosing Observable over legacy BI tools.
A new level of exploration
Escape the linear workbook model and explore your data on a two-dimensional collaborative canvas. Build a mind map of your thought processes, analysis steps, and results. Never lose track of what you’ve already explored, go back to previous thoughts and expand on them at any time.
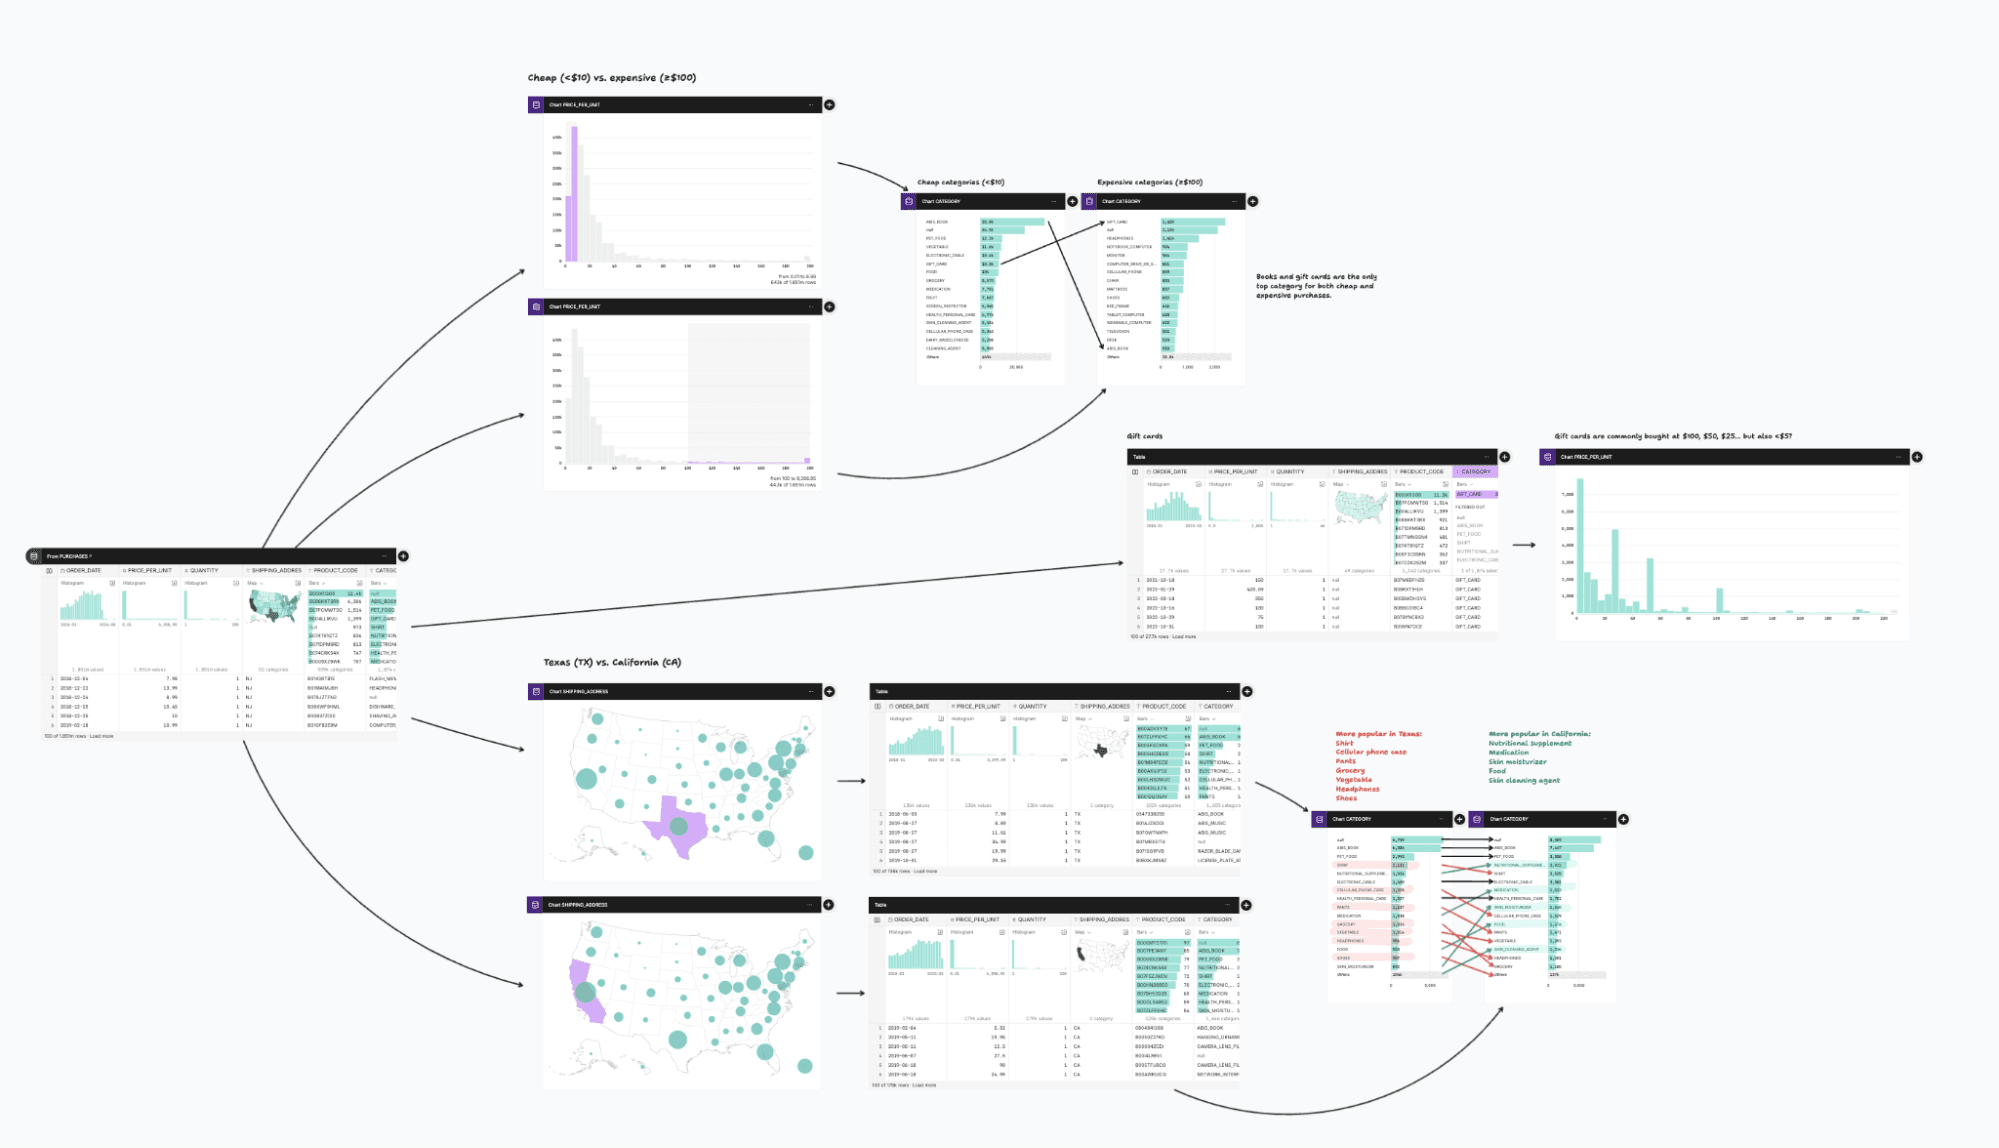
Data analysis involves branching paths that transform and summarize tables in different ways.
Zoom in and out of your analysis to work on a detailed visualization, or see the entire flow on one screen.
Get powerful guidance that keeps track of what you’ve already done and understands your data, in the same space you’re working in. Stay in the flow of analysis at all times.
Native, real-time collaboration for faster decisions
Why work alone and send messages back and forth when you can work together, in the same space, in real time? Ask questions, get help from others, and help others out. See what everyone else is seeing, no matter where you are. Use powerful tools together, and build better analyses and visualizations as a team.
One place for your data and visuals
Rather than having to switch between modes, pages, or even tools, perform all your analytics reporting work in one place. Explore your data as tables, filter and join them, then use them to create powerful visualizations. See and follow the steps that lead from your source data to your analysis products, and easily understand what others have built by following theirs.
Visualizations, not just charts
Yes, we all love a good bar chart. But many situations call for more advanced and specific charts and visualizations, the kinds that other tools don’t have at all, or only as opaque, isolated modules. Build better, more expressive, more useful visualizations on the canvas.
Get recommendations for more elaborate and specific visualizations, based on the latest research and decades of experience using data visualization to solve real problems. Create richer, more powerful visualizations than ever before. Explore the endless power and possibilities of Sankey diagrams, waffle charts, treemaps, advanced maps, and many more.
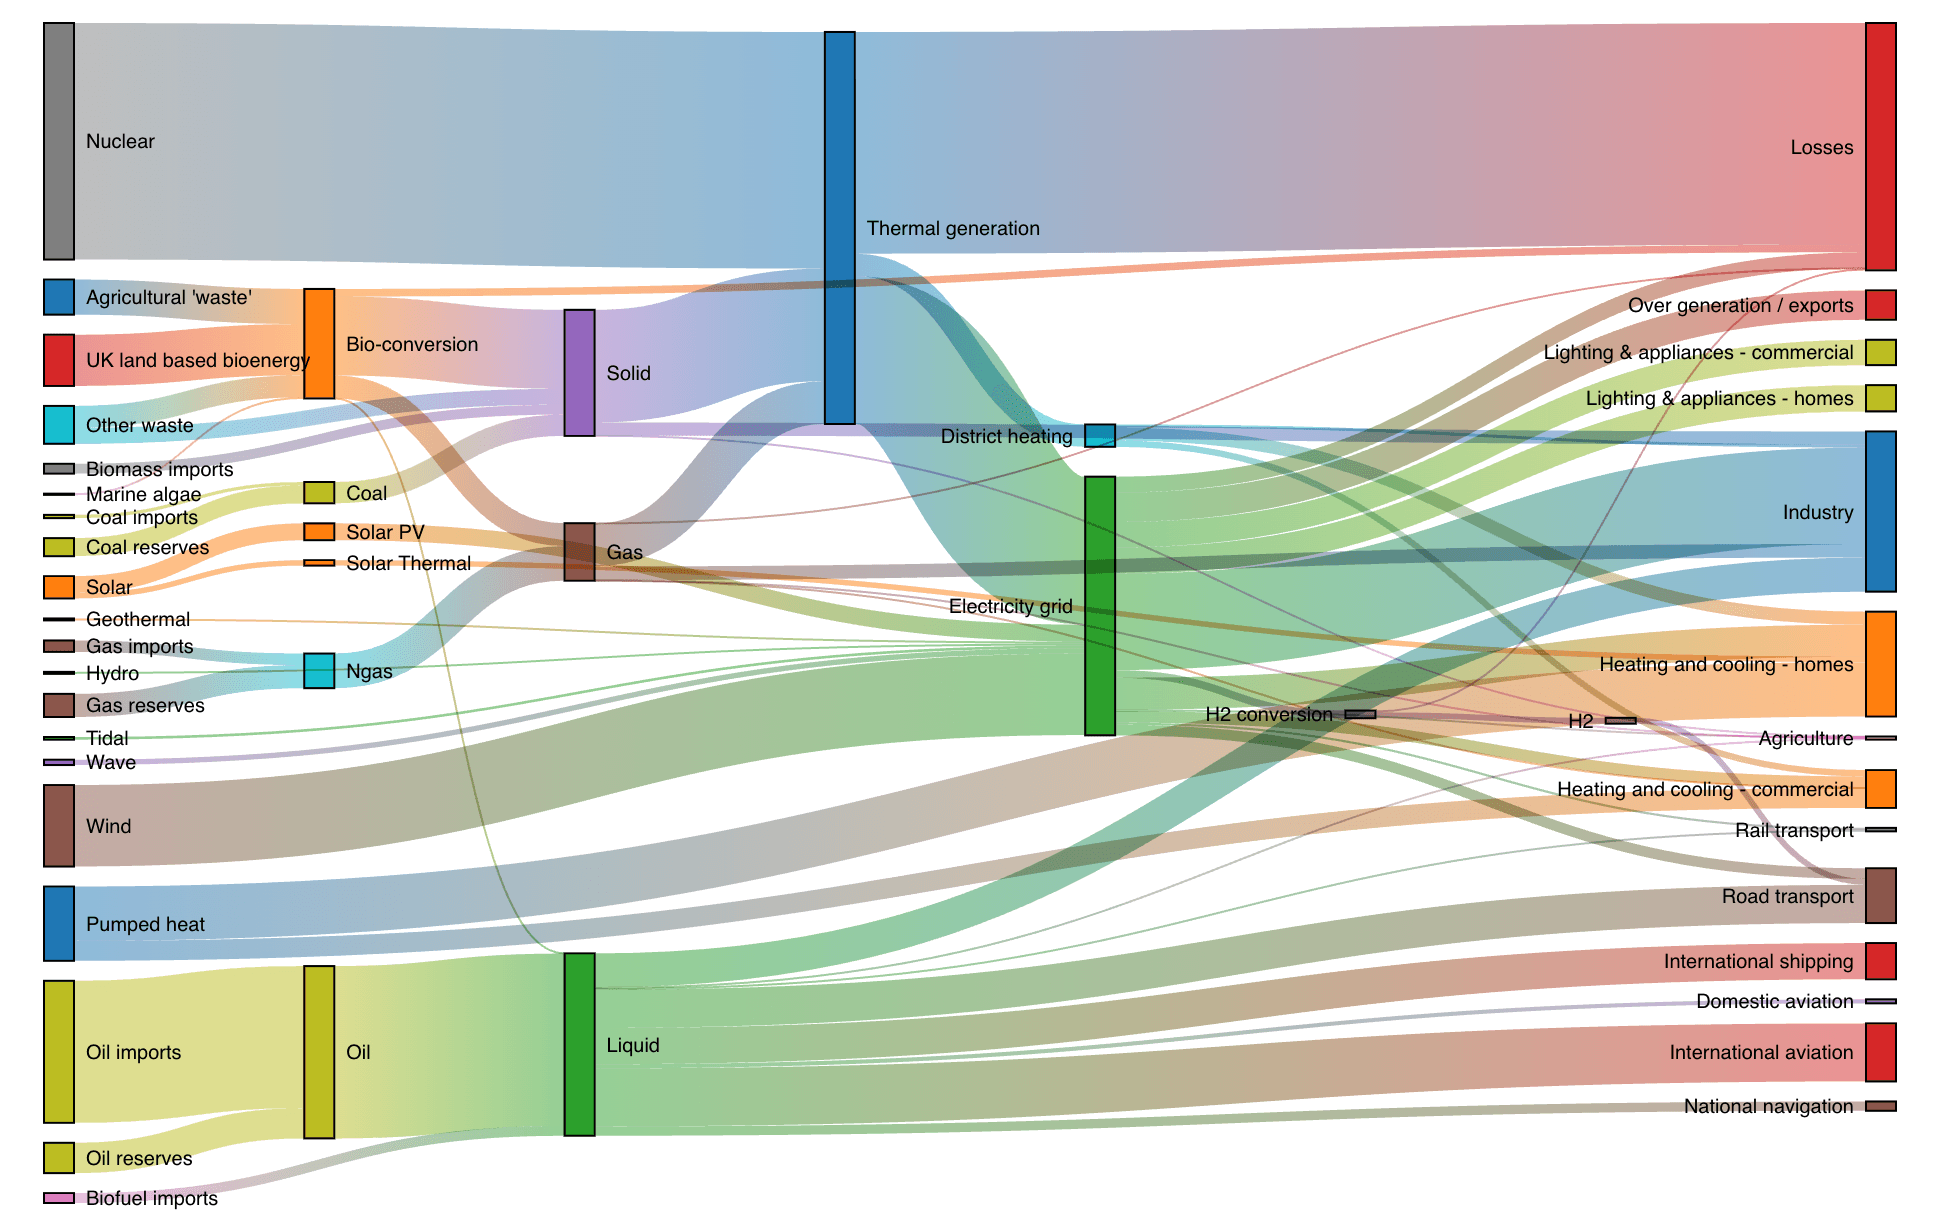
Sankey diagrams show flows through a network, like power from generation to distribution and use.
Need to shape your data first? Use SQL nodes to write and reuse queries directly on the canvas — no switching tools, no hidden steps. Whether you’re cleaning data, filtering, joining, or transforming; your queries stay visible, editable, and part of the larger story your analysis is telling.
Real-time collaboration for faster decisions
Bring everyone into the same space and collaborate in real time on a shared canvas that feels like a digital whiteboard. Sketch out ideas, annotate visualizations, and leave comments right next to the data. See what your teammates are seeing, no matter where you are. Use powerful features like annotations, stickies, and highlighting together to build better analyses and visualizations as a team.
A higher ceiling with SQL and code
Even the most powerful user interface can only get you so far. Write your own queries using the language of databases, SQL – either from scratch, based on what you’ve created using Observable’s canvas tools, or with a head start from our integrated AI. When you’re ready to share a more polished view, turn your canvas into a dashboard with a few clicks, no extra tools or rework required. Share insights with your team and keep everyone aligned. And because it’s your work, you can take it with you. Export your work in many different formats (PNG, SVG), or your data (CSV, JSON) in whatever format your team needs.
See it with your own eyes!
Whether it is the real-time collaboration, the single place for your entire analysis, the unparalleled visualization features, or the flexibility of using code, no code, or both – Observable is the BI solution for your needs today.
Curious to see all we have to offer for yourself? !