Platform
Resources
Pricing
Sign in
Get started
Trending
Recent
Most stars last month
Most stars all time
Recent
Showing
31-60
of
10,000
notebooks
Prev
Next
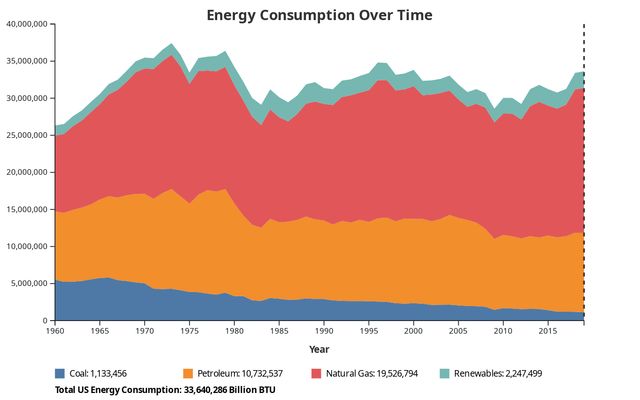
US Energy Transition Explorer
Sophia Moloo's Workspace
Apr 10
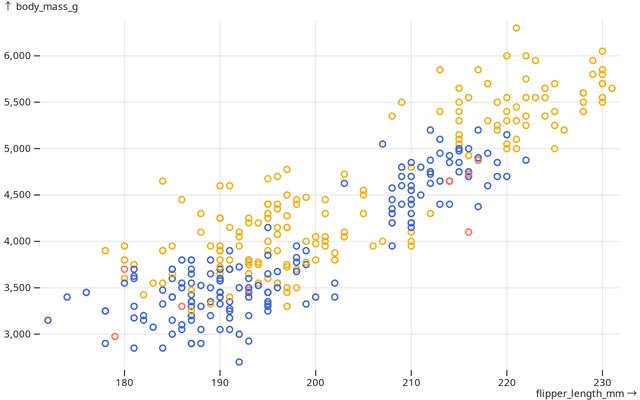
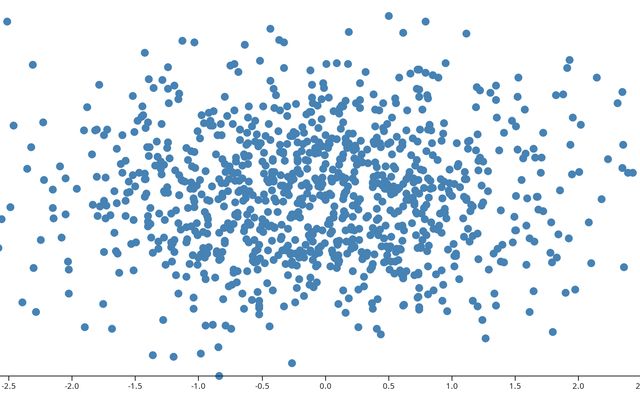
Plot Scatterplot
This notebook is a fork
joereese
Apr 10
Session 1: Introduction to Observable Plot (Code key)
This notebook is a fork
UNCC
Apr 9
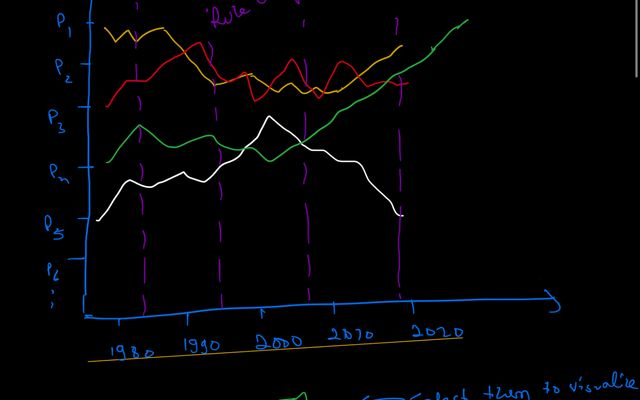
Rough Sketches
NYU
Apr 9
Plot Scatterplot
This notebook is a fork
brainfarts
Apr 9
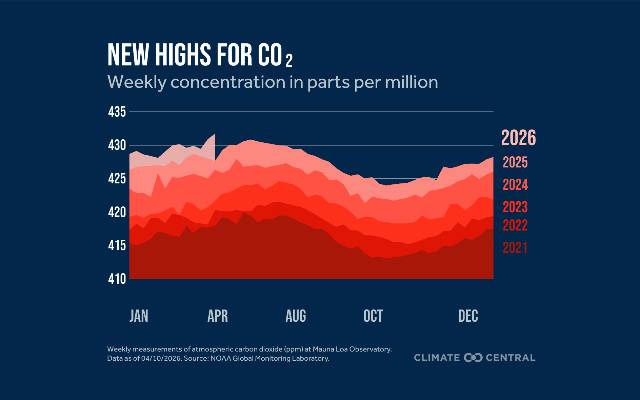
Top Years of CO2 (weekly)
Climate Central
Apr 9
•
1
1
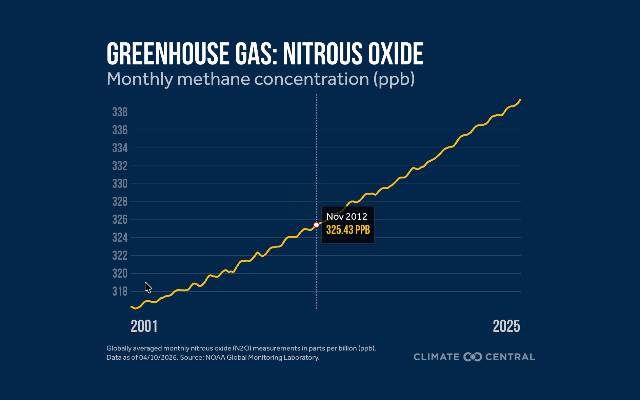
Greenhouse Gas: Nitrous Oxide
This notebook is a fork
Climate Central
Apr 9
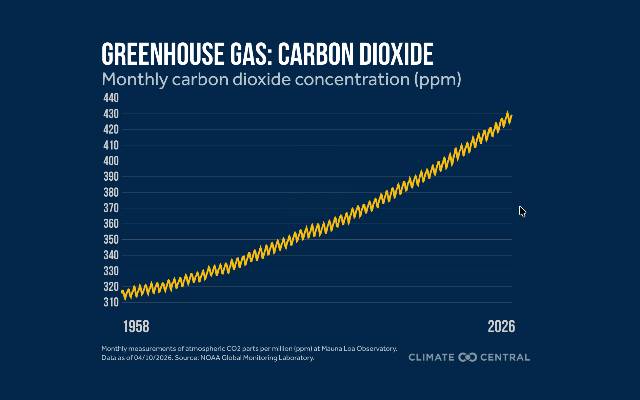
Greenhouse Gas: Carbon Dioxide
Climate Central
Apr 9
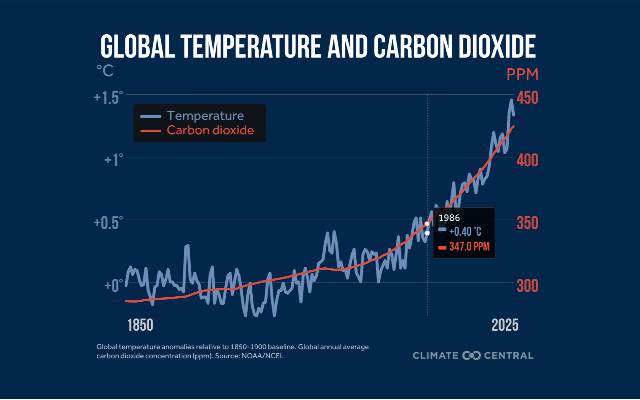
Global Temperatures & CO2
Climate Central
Apr 9
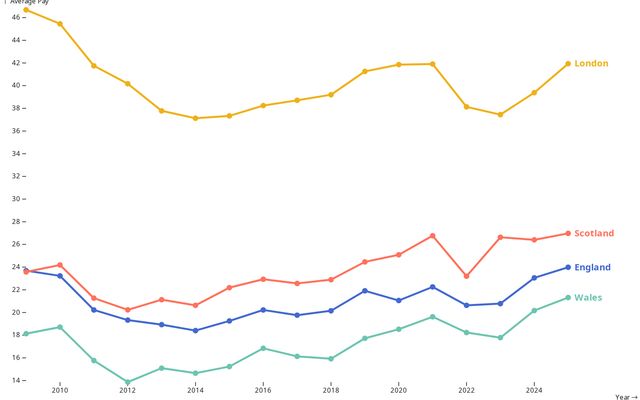
MEDIAN WEEKLY PAY: Countries' Average 2009-2025
This notebook is a fork
GWM 2026
Apr 9
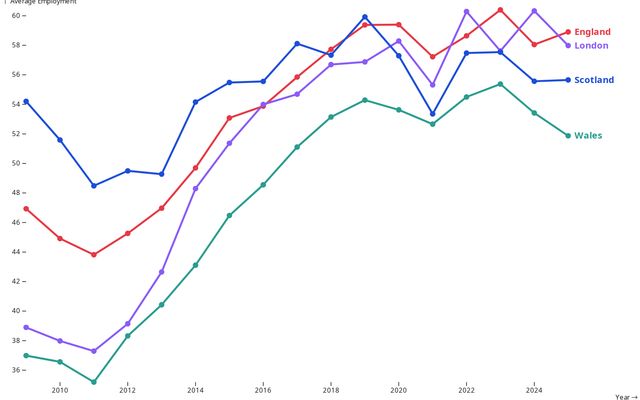
EMPLOYMENT: Countries' Average 2009-2025
This notebook is a fork
GWM 2026
Apr 9
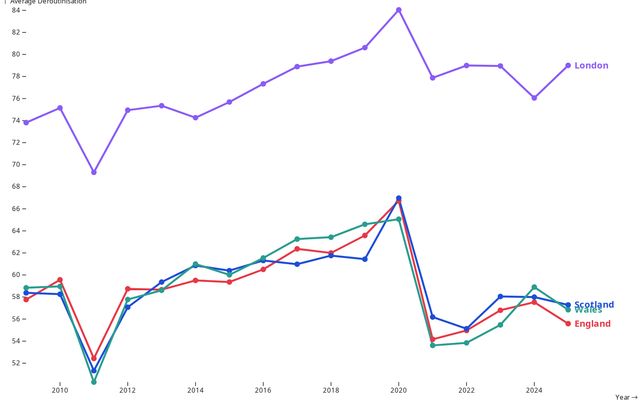
DEROUTINISATION OF JOBS: Countries' Average 2009-2025
This notebook is a fork
GWM 2026
Apr 9
Distribución Espacial de los Apellidos en Puerto Rico - Plantilla
This notebook is a fork
AN G
Apr 9
Distribución Espacial de los Apellidos en Puerto Rico - Plantilla
apellidospr
Apr 9
MEDIAN WEEKLY PAY: Countries' Average 2009-2025
GWM 2026
Apr 9
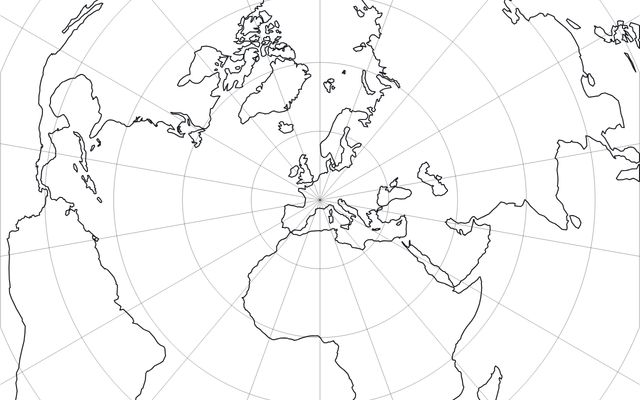
D3 Geographical Map
GVSU
Apr 9
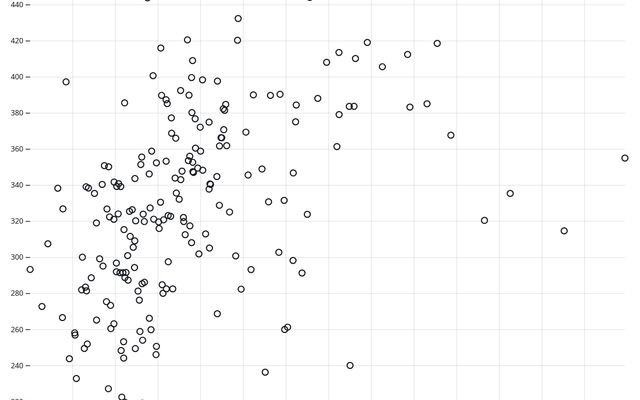
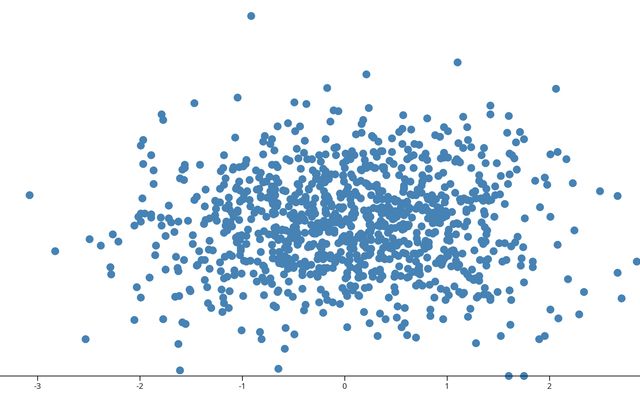
Productivity VS TOTAL SCORE - Great Britain (D3 scatterplot)
This notebook is a fork
GWM 2026
Apr 9
D3 Interaction
This notebook is a fork
GVSU
Apr 9
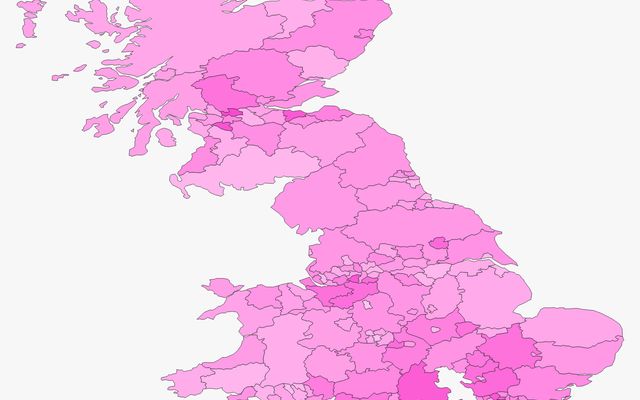
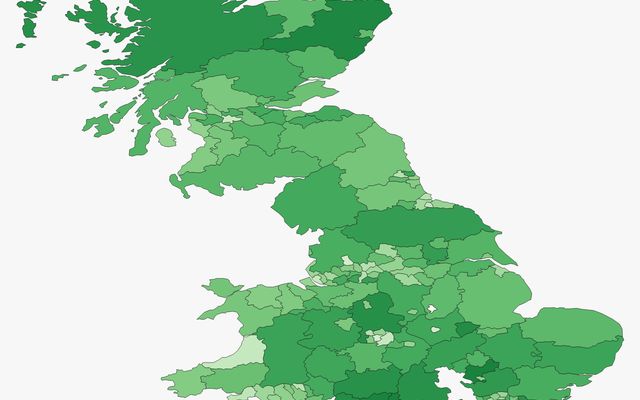
MAP Good Work Time Series- PRODUCTIVITY PER HOUR, 2009-2023
This notebook is a fork
GWM 2026
Apr 9
MAP Good Work Time Series- PROFESSIONAL JOBS, 2009-2025
This notebook is a fork
GWM 2026
Apr 9
MAP Good Work Time Series- SATISFACTORY HOURS, 2009-2025
This notebook is a fork
GWM 2026
Apr 9
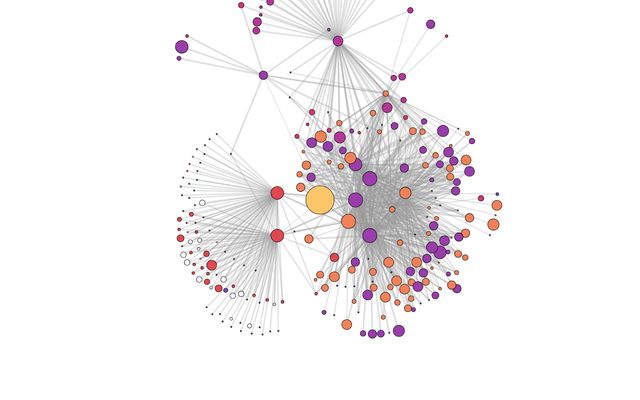
Force-directed graph
This notebook is a fork
Networks
Apr 9
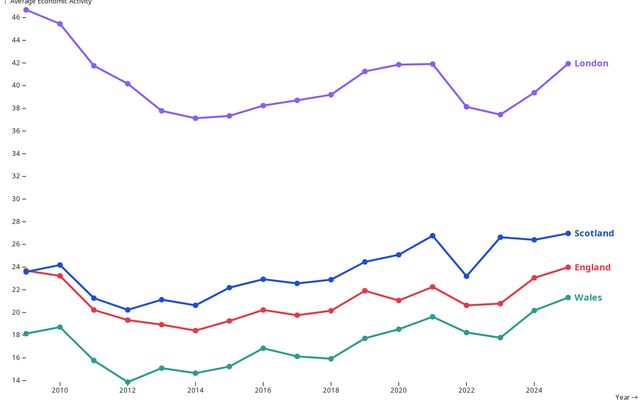
MAP Good Work Monitor - ECONOMIC ACTIVITY, 2009-2025
This notebook is a fork
GWM 2026
Apr 9
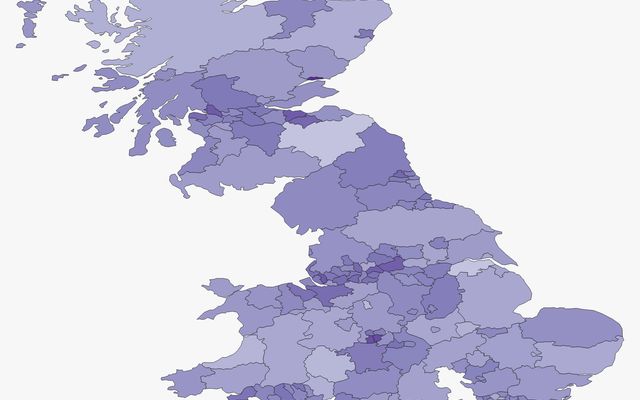
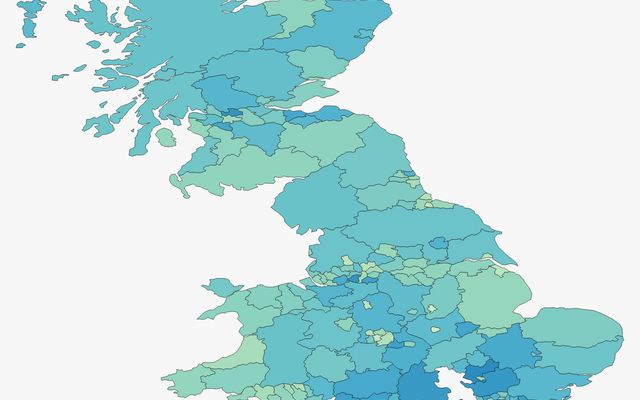
MAP Good Work Time Series- TOTAL SCORE, 2009-2025
This notebook is a fork
GWM 2026
Apr 9
MAP Good Work Monitor - DEROUTINISATION OF JOBS, 2009-2025
GWM 2026
Apr 9
D3 Interaction
Grand Valley State University
Apr 9
Plot Element Values
Fabian Iwand
Apr 9
•
3
Bar Chart Médecin par région
Data Viz APP5
Apr 9
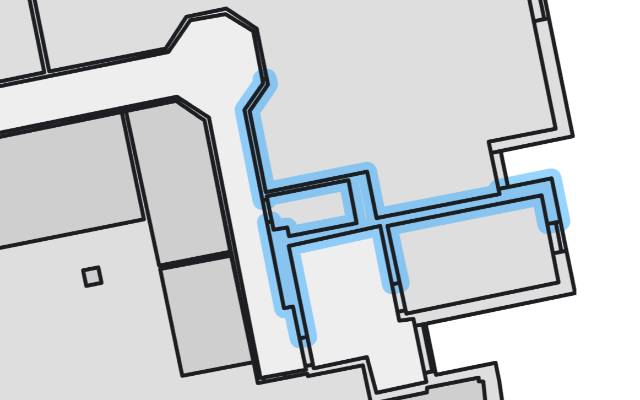
Plot: Projection domain
This notebook is a fork
Rose et Astre
Apr 9
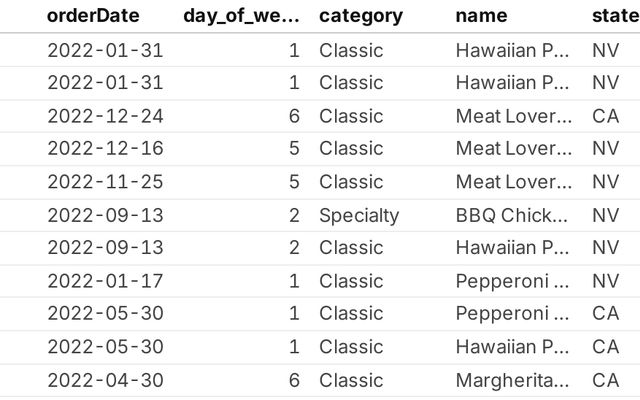
Pizza Orders Visual Exploration
Tyler Randall - Data Visualization
Apr 9
Showing
31-60
of
10,000
notebooks
Prev
Next