The challenge with working with data
Over the last decade, the growth in online technologies and tech-based services has resulted in an explosive growth in data. I saw this first hand, building high performance databases at Oracle, and then building petabyte-scale storage and database services at Google. As the volume of data being generated continues to increase, with the availability of these scalable infrastructure solutions, data storage and retrieval are no longer the biggest challenges.
The biggest challenge facing our connected world today is making sense of increasing quantities of increasingly complex data. For businesses, there is an urgent need for cross-functional teams to more efficiently analyze and visualize data and uncover insights that inform business decisions. An organization’s success is often tied to the quality and velocity of this decision-making.
Siloes and data complexity: The many barriers to businesses making informed decisions
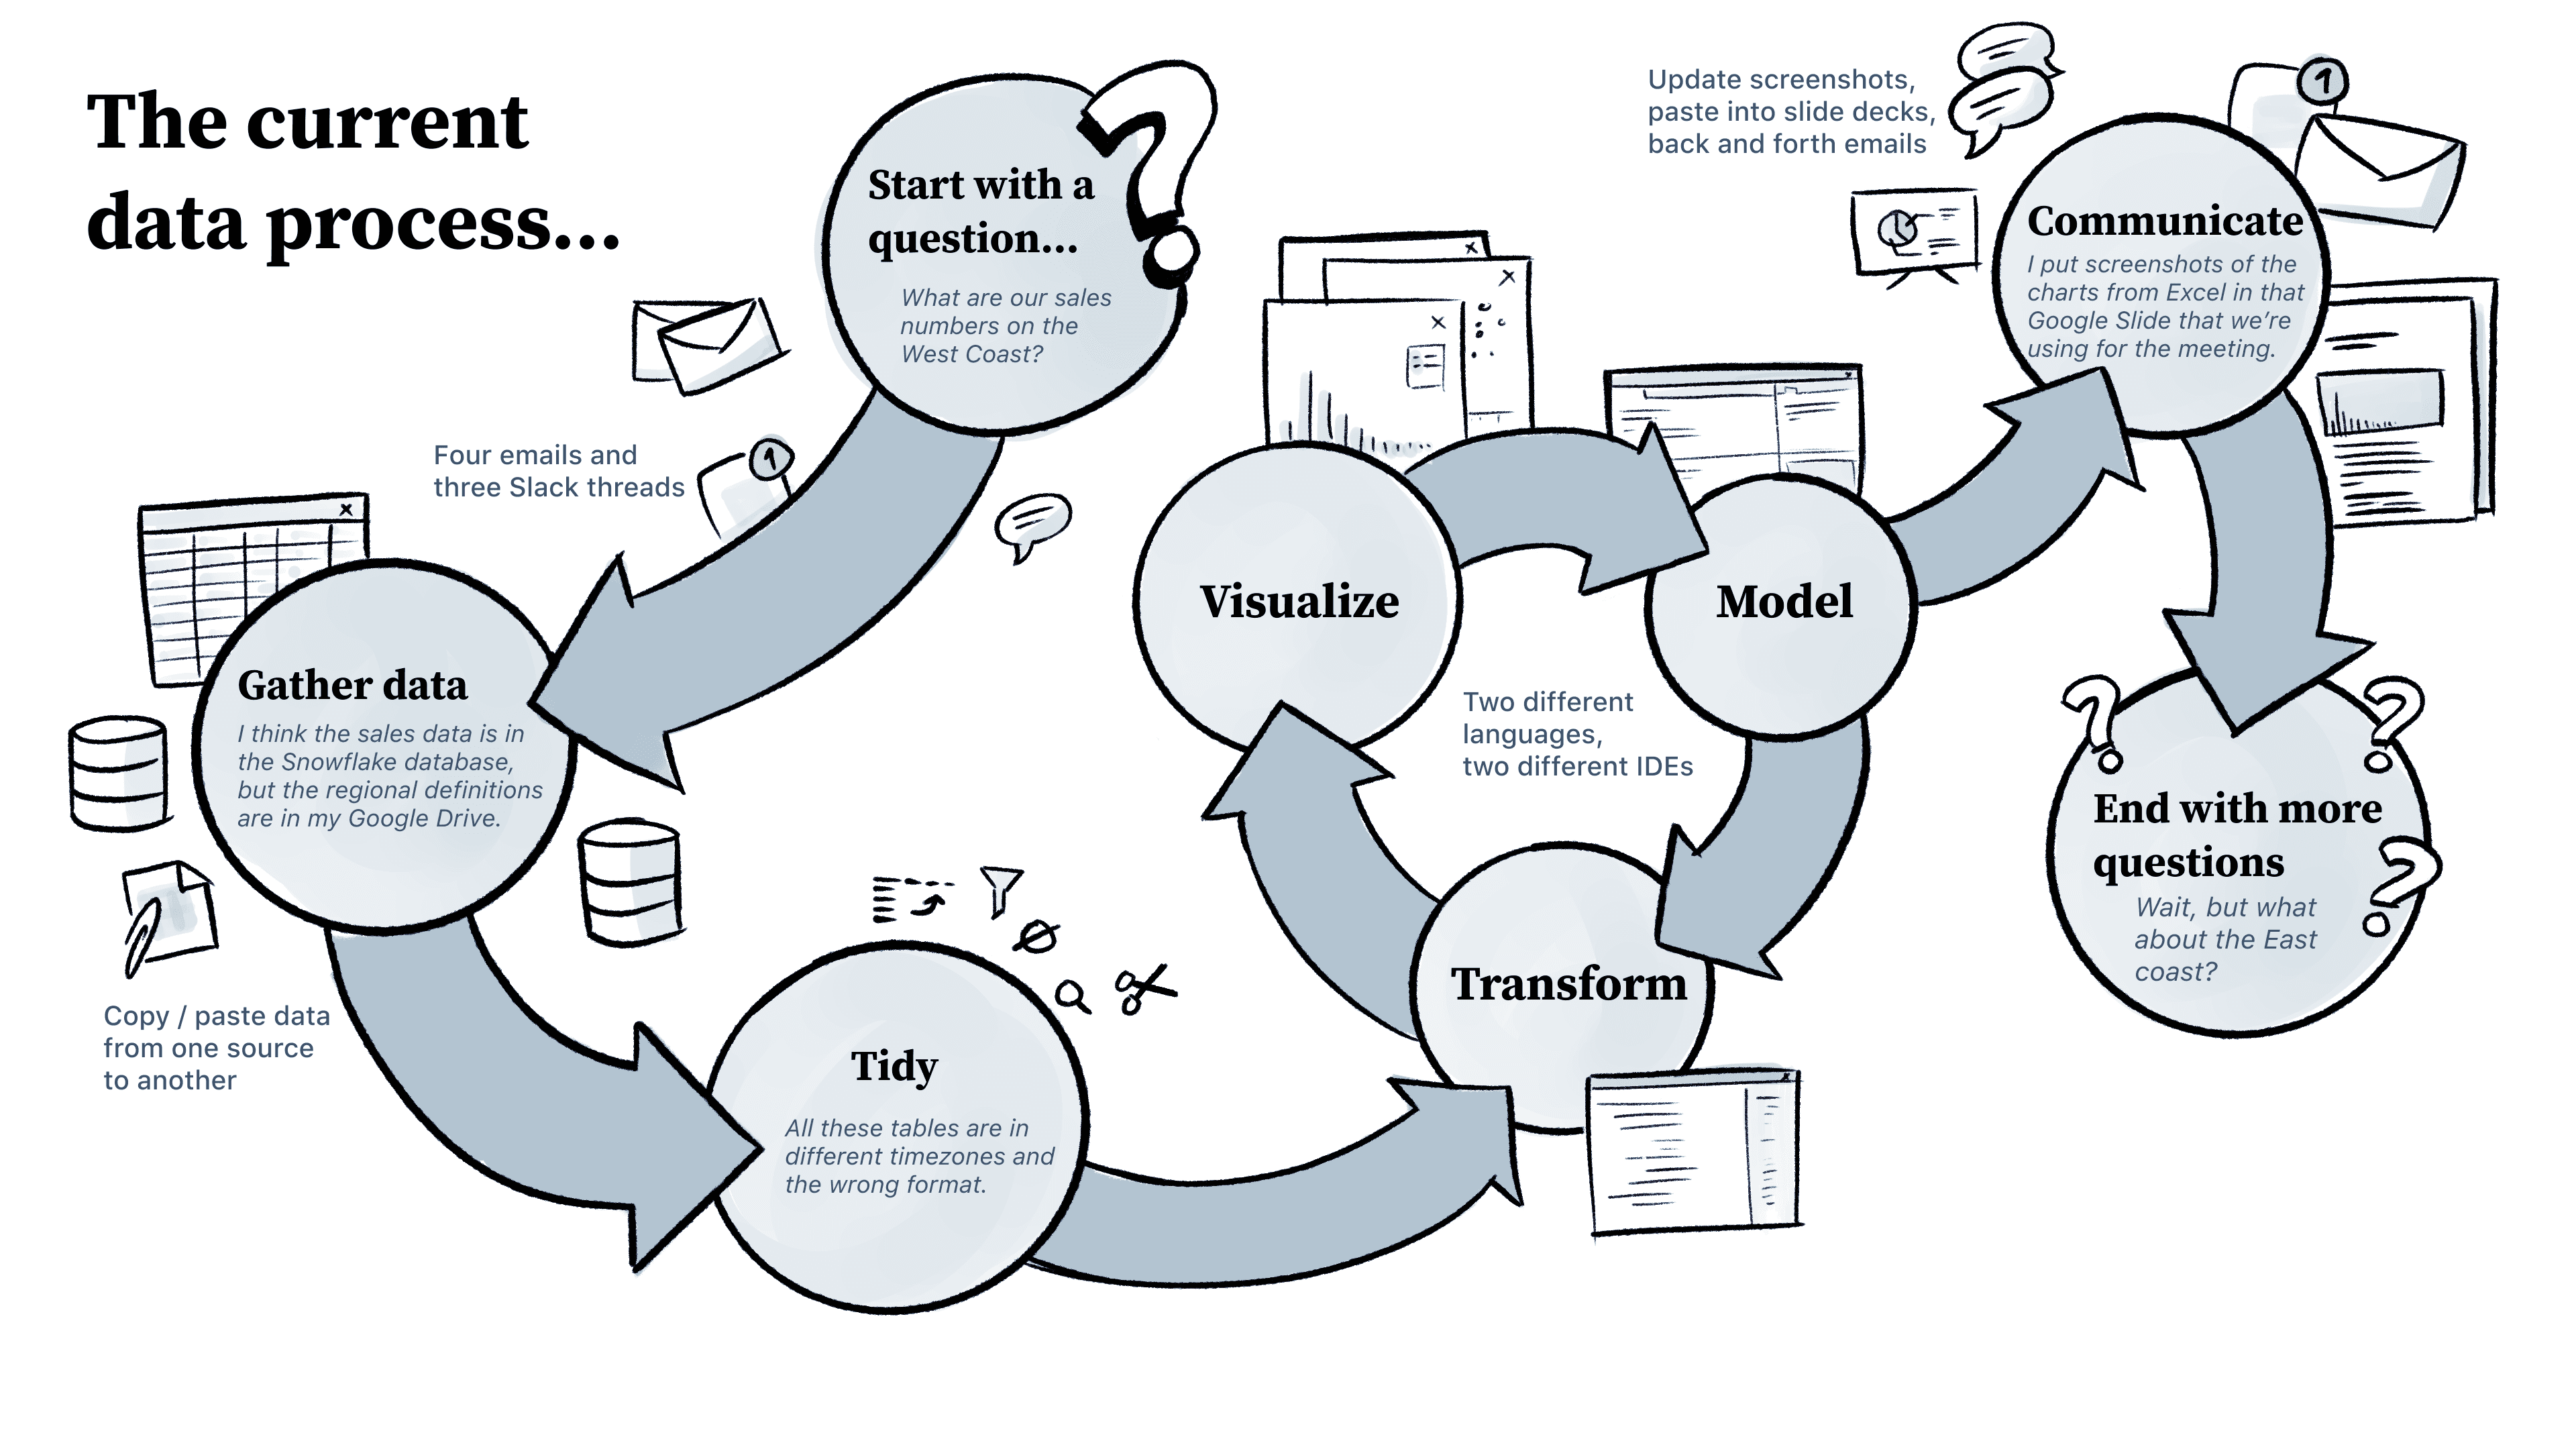
It’s not just that working with data itself is complex and is scattered across different parts of the organization. The end-to-end data journey to inform decision-making is also complex, involving multiple steps: from preparing to visualizing data, and finally, communication of insights.
Each of these steps involves different, disconnected teams of people, with different skill sets, and increases workflow complexity.
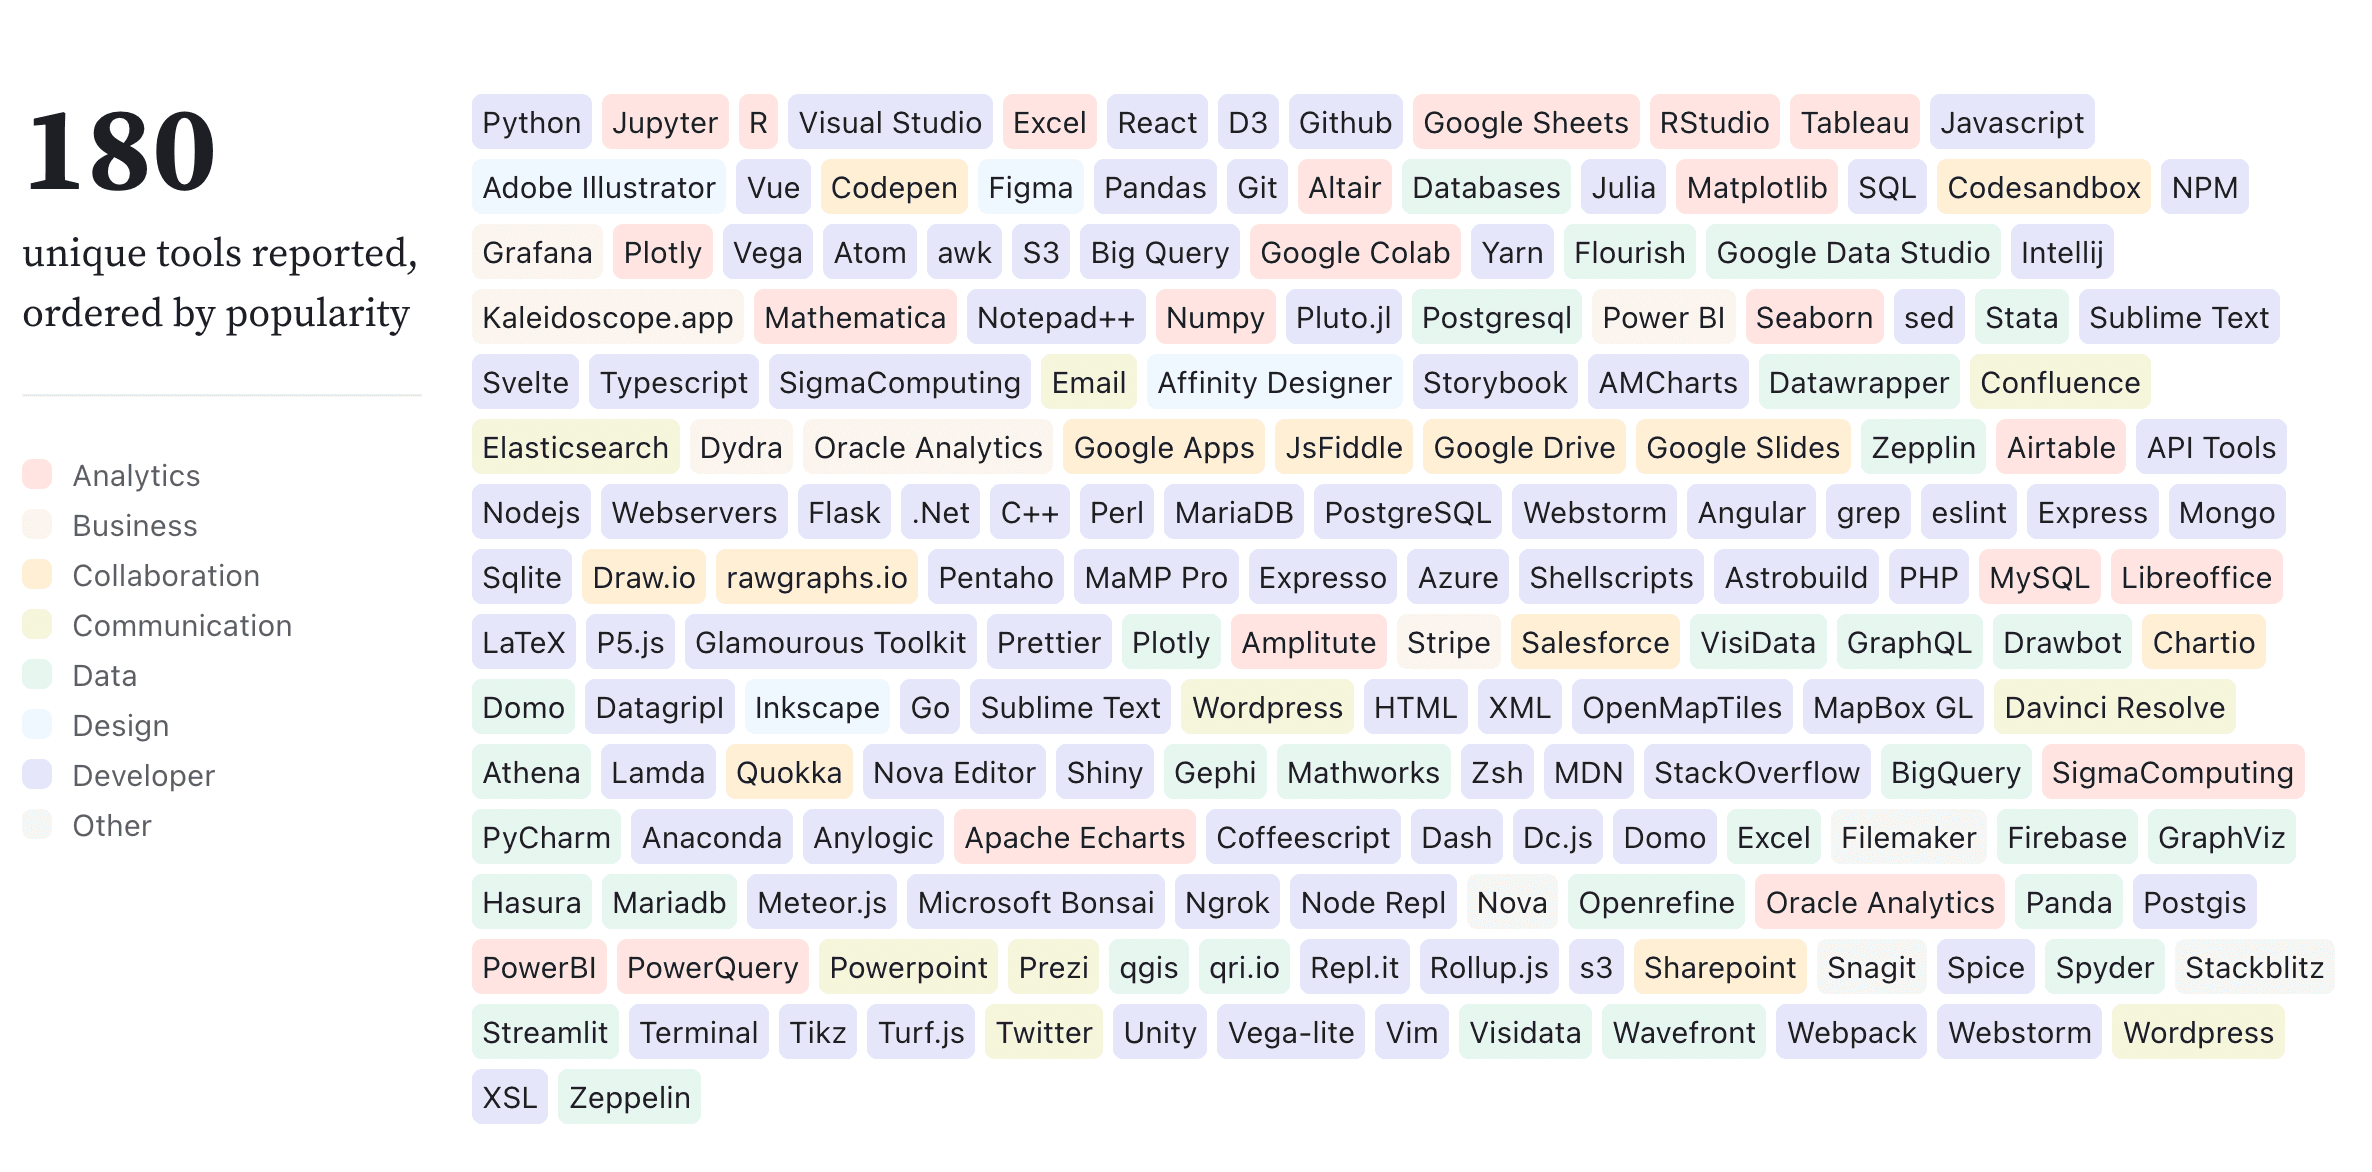
Our 2021 research report — The State of Data Viz — found that the team members involved in the above workflow use two, three, four, and sometimes even more tools to stitch together an end-to-end flow to analyze data, build data visualizations, and communicate insights. In fact, there were more than 180 unique tools named by respondents, optimized for different roles with different skills (see color-coded diagram below), that are involved in data analysis workflows.
It's painfully obvious that the current data exploration, analysis, and visualization ecosystem forces users to hop between tools and creates barriers between people who play critical roles in data-driven decision-making. This error-prone and often brittle process slows down organizational velocity. No one feels empowered to make decisions with high confidence because each person (or sub-team) has only a piece of the entire data puzzle.
Data practitioners: Cross-functional collaboration on data projects
Organizations can’t simply rely on separate data science or analyst teams to independently be the single source of fast data analysis and insights. Everyone in a team, irrespective of role or expertise, needs to be able to work together to make sense of their data.
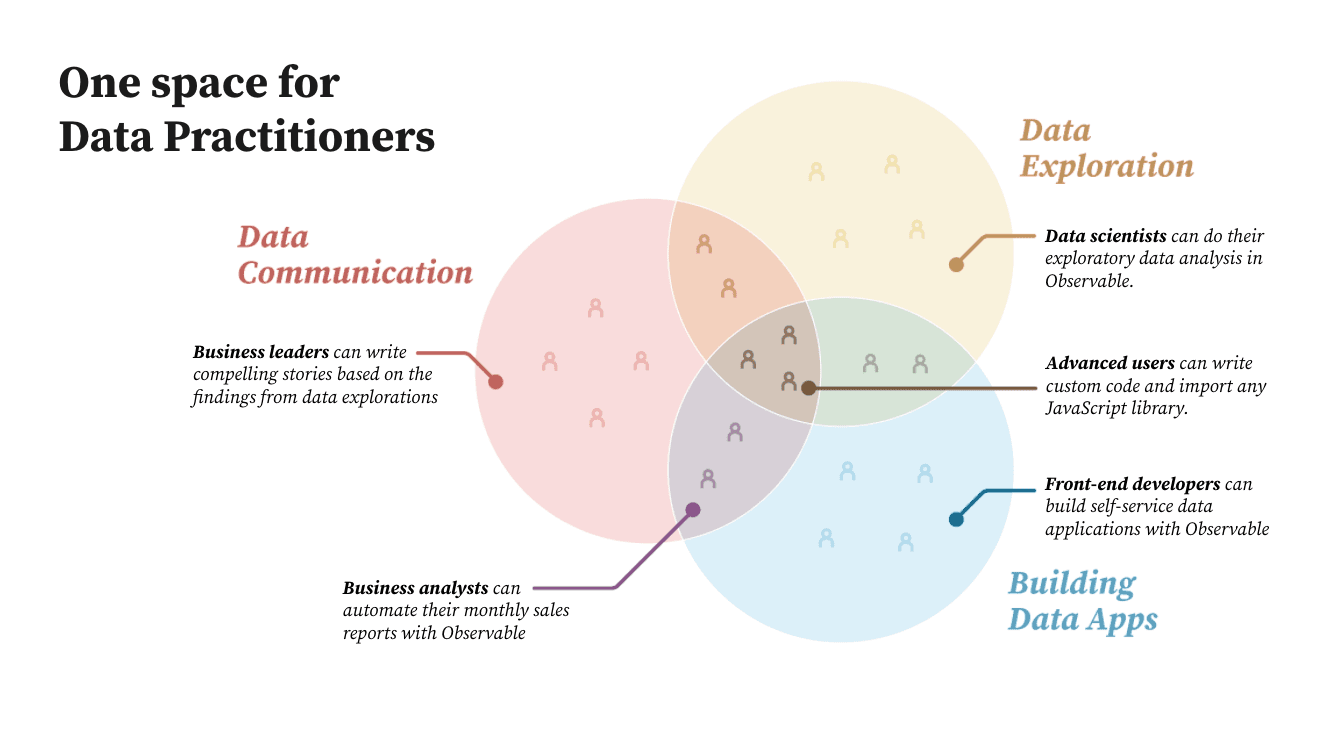
We’ve noticed through our user research, customer stories, and market analysis, that the following roles sitting in their own departments, along with their collaborators such as product managers, team leads, and business owners, need to work together as a collective, to gain insights for better data-based decisions:
Data scientists
Data engineers
Data architects
Business and financial analysts
Data visualization (dataviz) developers
Business Intelligence / Operational dashboard developers
Observable uses the term data practitioners as an inclusive identity covering all of these people who work together on data.
These data practitioners need to be able to be productive in their individual work where they can utilize their expertise, as well as be productive when working collaboratively with cross-functional colleagues. The current tool ecosystem doesn't meet the market need to enable this collective set of people with different expertise in one place, and allow them to focus on getting the work done, without wasting precious time and resources wrangling with disjoint tools. Teams will have a huge business advantage when they can collaborate across these roles without friction and make decisions quickly. That is the future of data work!
The rise of data collaboration
Data collaboration for data practitioners is an active, iterative, and transformative process. In fact, data collaboration can become an organizational practice focused on better outcomes for the entire business. Each organization must decide and then live the practice. Similar to DevOps, data collaboration is about the symphony that happens between the people, the processes, the tools, and the culture involved.Companies need a new way to thrive in this new world!
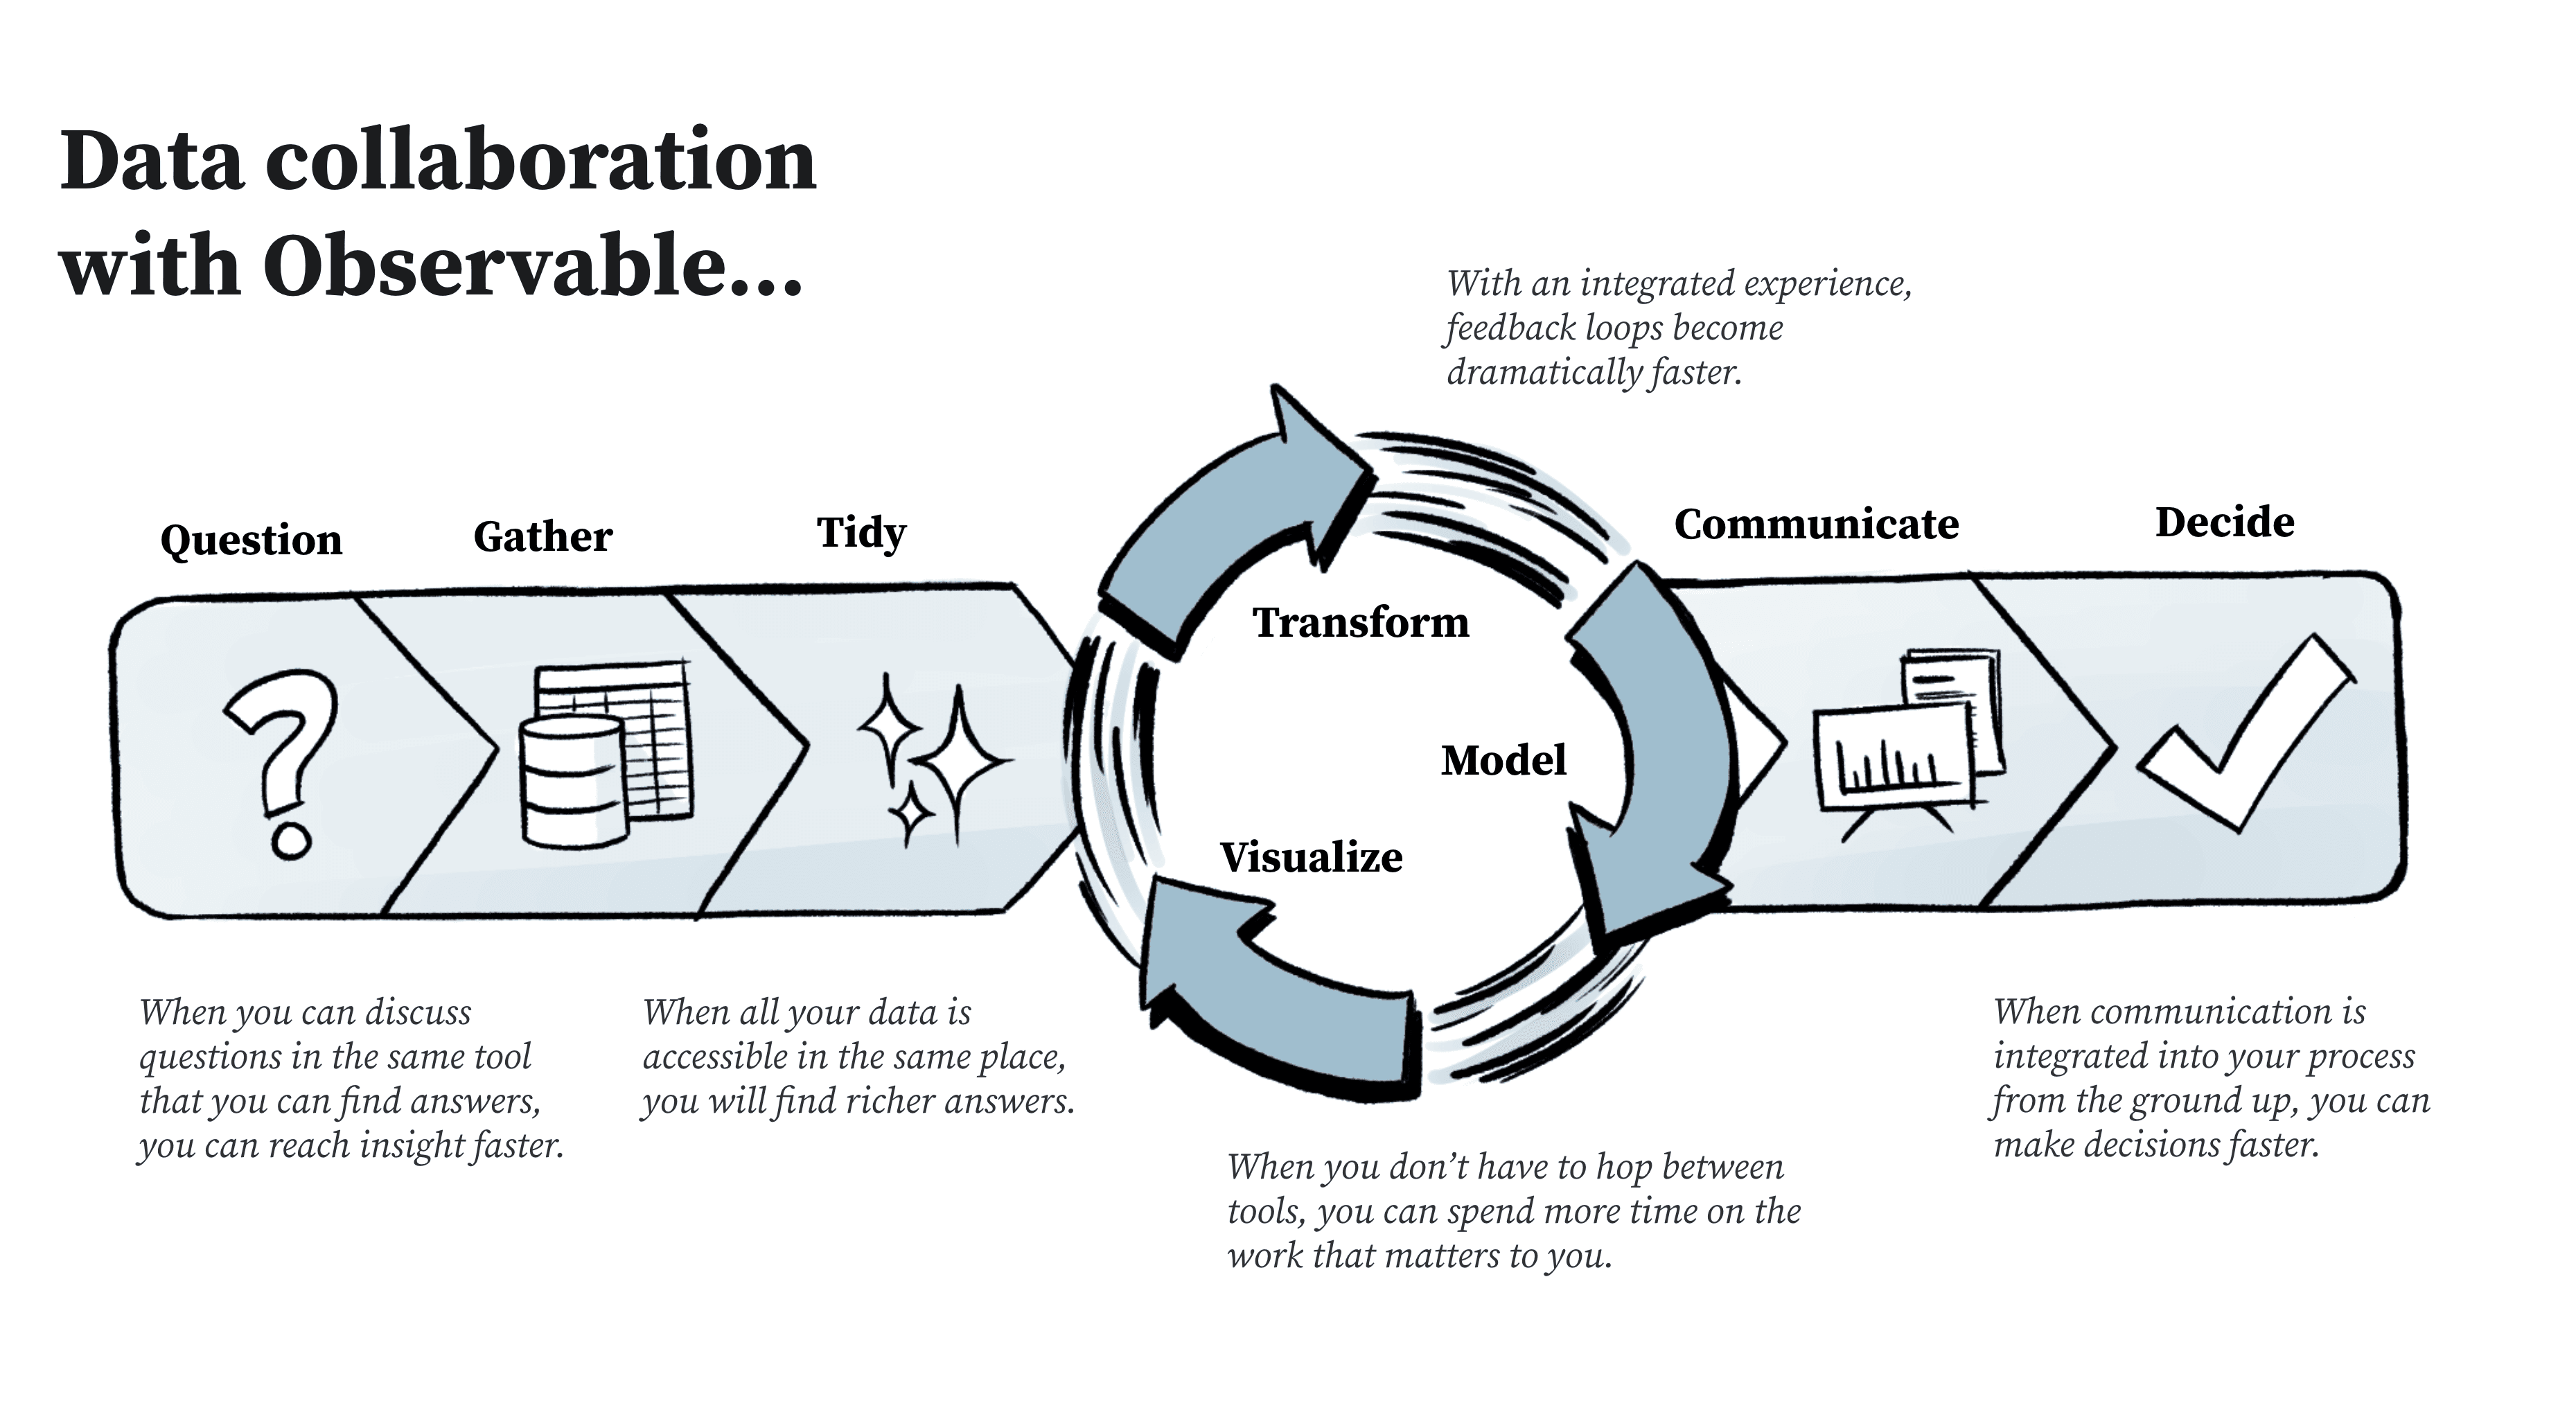
A new generation of data tools is needed that allow each of the cross-functional experts within the data practitioner umbrella, to maximize their effectiveness and seamlessly progress from ideas and data analysis to insights and communication in one space, without tool hopping or hitting a wall with their colleagues. The most empowering part of data collaboration is that each organization can determine its own practices and processes, since it’s not a static deliverable or tied to gluing together disparate tools.
Observable: Shaping the future of data collaboration
The Observable platform is built to enable data teams to work together in a single, seamless environment. By eliminating tool hopping and reducing workflow complexity, Observable empowers teams to work more efficiently as they explore data, share data visualizations, and unlock insights. Get started with Observable today to collaborate with your team and share rich, expressive data visualizations with the world.


